Highlights for policy makers:
- Recovery Progress
- Job Openings Down 25% Since December
- Labor Force Still Below Recovery
- Unemployment Claims at Nearly a Quarter of US Total
- May Revise Pulls UI Fund Repayments
- California State Trust Fund Solvency Lowest Among the States
- CaliFormer Businesses
- May Revise: Projections Show a Reduced Surplus; Not a Deficit
Recovery Progress
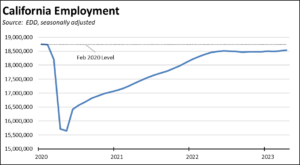
As discussed in our preliminary report, the April jobs and labor force data was more positive than in recent months. Nonfarm wage and salary jobs growth at 67,000 was the highest since April 2022. The employment gains of 25,200 reversed a 9-month long dip, finally bringing the total above the previous near term high in June 2022. Nonfarm jobs are now 2.1% above the pre-pandemic peak. Employment—the number of people working in the state—in sharp contrast remains 1.1% below.
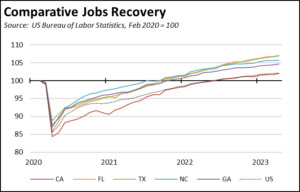
Since April 2020, California has seen nonfarm jobs increase by over 3 million. Most of these, however, came from finally relaxing the series of state restrictions that closed them in the first place—a hyper example of the jobs growth that can occur when restrictive regulations are reformed. The true jobs growth shown by the net increase compared to the pre-pandemic peak in February 2020 puts California at a net gain of 365,400, or well below the 899,800 posted by Texas and 637,100 by Florida but still ahead of 4th place North Carolina (265,400) and 5th place Georgia (216,600). Combined, however, North Carolina and Georgia are just over half California’s size by population, yet their combined net jobs growth to date exceeds this state’s by 32%.
California is finally creating jobs, but a large number of other states, especially those with lower costs of living and costs of doing business, have come out of the pandemic recession creating jobs at a much faster rate. Looking at just the 5 states ranked the highest by net job gains since the previous peak, the stronger performance in the other four reflects the results of covid-era job closures that did not cut as deep as California’s combined with subsequent policies that emphasized a much earlier return to work. Since the 4th quarter of 2021, California has largely tracked the US average, with monthly gains exceeding the US average in only 8 out of the 19 months.
California also is not creating jobs at a rate fast enough to produce recovery in the employment numbers. While the April data finally reversed the employment dip in place since last June, overall employment numbers have essentially stagnated since that point rather than continuing progress towards a recovery level.
Job Openings Down 25% Since December
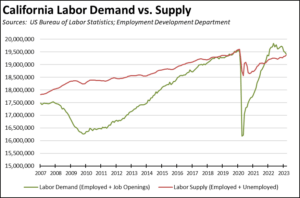
As reflected in the job openings data, the period of excess labor demand essentially has closed. While these conditions likely vary by industry, the overall opportunities for substantial future jobs growth are diminishing as firms have cut back on their hiring plans. Nationally, unfilled job openings dropped 15% between last December and March; in California, they plunged 25%.
California has just gone through a period when much stronger jobs creation was possible, but state policies that emphasize benefits over earned income combined with high costs of living that encourage workers to move to other states rather than moving here dampened those prospects. Should the trends shown in the chart continue, the shift from excess demand (employed plus unfilled job openings) to excess supply (employed plus unemployed) also has ramifications for additional wage growth in the upcoming period.
Labor Force Still Below Recovery
As indicated in the discussion above, a key factor holding back stronger jobs creation has been the overall numbers in the labor force. In the April data, the California labor force was still 196,400 short of recovery, or 1.0% below the level in February 2020. Measured by labor force participation rate, California also falls short of recovery with a seasonally adjusted participation rate of 62.4% in April compared to 63.0% in February 2020.
Adding to this factor is the overall downward trend in labor force participation even prior to the pandemic. Strong economic growth in the 1980s was marked by the rapid rise in the participation rate, especially the entry of women into the labor force. The Great Recession produced the reverse, in particular the permanent separation of many older workers, while rising minimum wage saw fewer opportunities for younger workers.
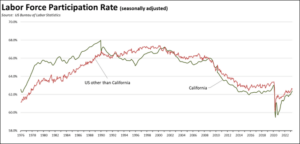
In addition, California generally has had a lower participation rate than the other states since the 1990s even though the state’s demographics were relatively younger than the US overall. Countering this lower rate, jobs growth instead was fueled by continuing migration into the state, both from other states and other countries. California’s high and growing costs of living have choked off this source of labor supply, with the pattern of migration now reversing to states with greater opportunity both for income and wealth accumulation such as through home ownership.
Looking at the demographics, the available data differs somewhat, consisting of moving 12-month averages from the Current Population Survey rather than the modeled snapshots contained in the monthly reports. Using this source, the greatest shortfall compared to the pre-pandemic period is in the prime working ages of 25-54, showing a gap of 264,000. Older workers in the workforce have risen slightly, while younger workers show a similar small decline.
| California Labor Force Demographics | |||
| Source: EDD, 12-month moving averages | |||
| Feb 2020 | Apr 2023 | Change | |
| Total | 19,430,000 | 19,180,000 | -250,000 |
| Age | |||
| 16-19 | 531,000 | 571,000 | 40,000 |
| 20-24 | 1,741,000 | 1,677,000 | -64,000 |
| 25-54 | 12,987,000 | 12,723,000 | -264,000 |
| 55-64 | 3,019,000 | 3,039,000 | 20,000 |
| 65+ | 1,152,000 | 1,170,000 | 18,000 |
| Gender | |||
| Men, 16+ | 10,605,000 | 10,527,000 | -78,000 |
| Women, 16+ | 8,824,000 | 8,654,000 | -170,000 |
| Race/Ethnicity | |||
| White | 14,077,000 | 13,521,000 | -556,000 |
| Black | 1,196,000 | 1,163,000 | -33,000 |
| Latino | 7,293,000 | 7,534,000 | 241,000 |
By gender, women still show slightly lower level of recovery than men. By race and ethnicity, changes in labor force in part reflect the shifting demographics in the overall population as well as migration patterns.
Because the underlying population numbers for the prime working age cohort also dropped in this period, the participation rate increased somewhat, going from 80.7% in February 2020 to 81.2% in the latest data for April 2023. In comparison, the participation rate in April 2009 was 82.1% for this age group. Age 55-64 also saw a participation rate increase from 64.2% to 65.3%, while age 65 and older saw an increase in numbers but a slight decrease in the participation rate from 19.5% to 19.1% as the underlying population share for this group also grew.
California Labor Force by Age
| California Labor Force by Age | ||||||
| Source: EDD, 12-month moving averages | ||||||
| Civilian Population (16+) Share | Labor Force Participation Rate | |||||
| Apr 2009 | Feb 2020 | Apr 2023 | Apr 2009 | Feb 2020 | Apr 2023 | |
| Age | ||||||
| 16-19 | 7.8% | 6.4% | 6.5% | 34.1% | 26.7% | 28.5% |
| 20-24 | 9.4% | 8.2% | 8.2% | 71.6% | 67.8% | 65.6% |
| 25-54 | 55.4% | 51.5% | 50.5% | 82.1% | 80.7% | 81.2% |
| 55-64 | 13.3% | 15.1% | 15.0% | 66.4% | 64.2% | 65.3% |
| 65+ | 14.2% | 18.9% | 19.7% | 17.6% | 19.5% | 19.1% |
| Totals | 100.0% | 100.0% | 100.0% | 66.2% | 62.2% | 61.9% |
As the participation rate drops, however, the population numbers play an even greater role in a state’s ability to provide the labor essential to growing jobs. Until recently, California experienced an unbroken rise in population, with migration especially playing a key part in shaping the share of population within prime working age. The participation rate consequently dropped since the mid-term high in April 2009 as the population share of this age cohort dropped 5 percentage points.
In fact, keeping the higher participation rate for age 65+ constant and returning the other age groups back to the higher participation rates in April 2009, the best California could do would be a total labor force participation rate of 63% due to the shifting age structure, in particular shrinkage of the prime working age cohort. Returning to the 66% level would require a much higher participation rate for the lower 3 age groups, including prime working age close to a likely unattainable 87% rate.
Alternatively, however, the same results can also be achieved by policy changes making it possible for this key age group to work and live more affordably in this state. This approach would include policy changes that would make home ownership—and ownership of the types of homes this age group is now seeking in other states—more accessible along with shifts to the other policies driving the costs of living, including for the energy required to live in those homes, commute to work, and as a key cost component to the other goods and services now driving the cost of living in this state.
A renewed focus on declining state budget revenues has put back into perspective at least one reason why California should be concerned about jobs growth, and jobs cannot grow without the workers required to do them. Some put their beliefs in technology replacing a greater share of workers in the future in particular with the recent introduction of artificial intelligence. But this warning has been in play since the introduction of the water wheel and steam loom, and the result consistently has been an expansion of jobs made possible by the lower costs of living from greater efficiency and production and expansion of jobs that previously did not exist but were made possible by the new technology and standards of living.
Unemployment Claims at Nearly a Quarter of US Total
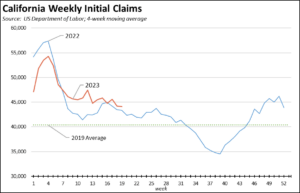
Measured on a four-week moving average, initial unemployment insurance claims essentially dropped back to their 2022 level for the week ending May 13 as seasonal hiring picked up. The overall reliance on this program, however, remains strongly elevated in California. While this state represents 11.6% of the US as measured by nonfarm jobs, initial claims for the week ending May 13 were 19.7% of the total, and insured unemployment—a proxy for continuing claims—were more than double the state’s share at 24.8% of the total as of the week ending May 6.
Note that these shares are based on the reported data and likely will move somewhat higher in the coming weeks due to extensive fraud in Massachusetts. The extent of that fraud is shown in the fact the US total dropped the week of May 13, but this shift was attributed primarily to the actions taken by Massachusetts to combat the fraudulent filings.
May Revise Pulls UI Fund Repayments
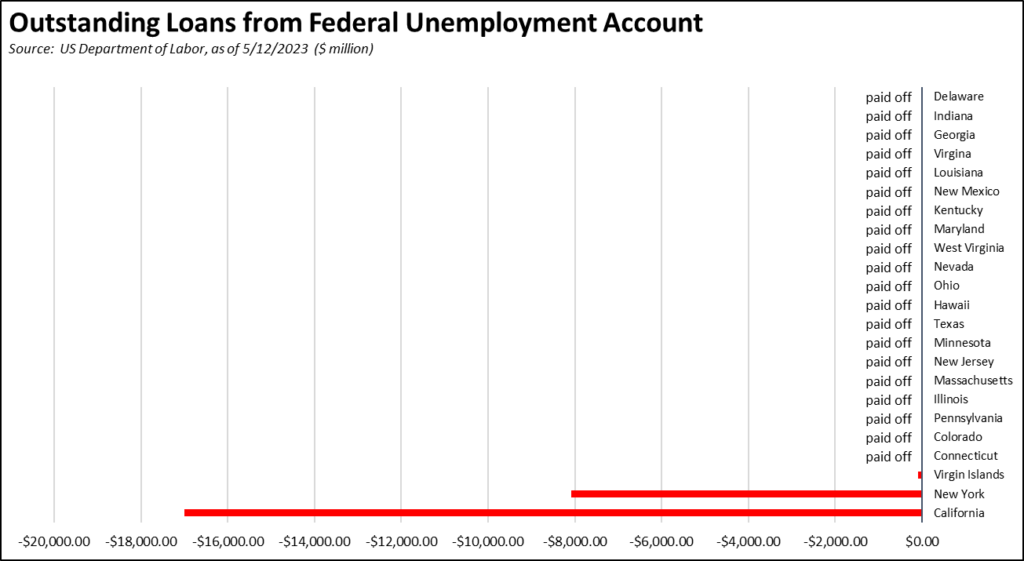
The largest proposed reduction in the recently released Budget May Revise would eliminate the previously proposed down payment on the state’s federal Unemployment Insurance (UI) Fund debt. By failing to propose solutions to this debt, the May Revise incorporates a growing tax increase on California employers, both by ensuring that the state tax rate will remain at its highest levels and by imposing an additional increase in the federal tax rate that will grow over time. California’s federal debt in the latest report for May 18 is $17.1 billion.
In fact, the May Revise adds to the debt problem by proposing that the annual interest payment ($306 million) on the federal loan balance be paid by yet additional borrowing of this amount from the Unemployment Compensation Disability Fund. This compounding of debt on debt is the fiscal equivalent of taking out a new credit card to help pay down the balance on all of the other existing ones.
With the recent action by Connecticut, California and New York are now the only two states with a substantial debt being carried over from the pandemic period. The others have paid off these loans including most using the federal pandemic assistance funds that were allocated for this purpose. Most of these states, including Connecticut, also used these actions to restore the fiscal health of their state funds while reducing tax rates on employers.
California State Trust Fund Solvency Lowest Among the States
In its recently release annual Trust Fund Solvency Report, US Department of Labor ranked California last among the states, DC, and Puerto Rico. Only perennially insolvent Virgin Islands was ranked lower.
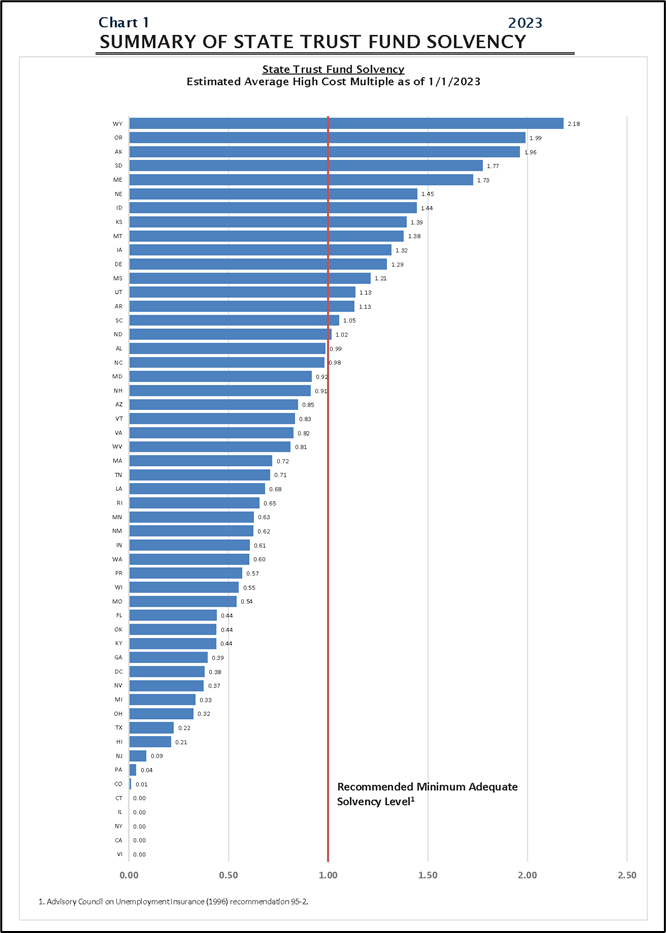
Based on the January 1, 2023 fund balances, the report indicates that California is only one of 4 states and Virgin Islands that may be subject to an increase in the federal tax rate in 2023. Two of the states have since paid off their debt. California is also one of 17 states no longer eligible for interest-free borrowing (California was last eligible in 1990).
The report also highlights on its first page a core reason why there has been a substantial decline in the number of states with trust fund debt:
Many states were able to supplement their UI trust funds through the use of funding available through the CARES and ARP Acts.
CaliFormer Businesses
Additional CaliFormer companies identified since our last monthly report are shown below. The listed companies include those that have announced: (1) moving their headquarters or full operations out of state, (2) moving business units out of state (generally back office operations where the employees do not have to be in a more costly California location to do their jobs), (3) California companies that expanded out of state rather than locate those facilities here, and (4) companies turning to permanent telework options, leaving it to their employees to decide where to work and live. The list is not exhaustive but is drawn from a monthly search of sources in key cities.
May Revise: Projections Show a Reduced Surplus; Not a Deficit
The release of the May Revise was dominated by its revised estimate placing general fund revenues $31.5 billion lower over the budget window than expected when the current Budget Bill was passed last year. Proposed budget solutions include some expenditure cuts ($6.7 billion) but concentrate on expenditure delays, fund shifts, borrowing, trigger cuts, and some revenue enhancements in particular expansion of the proposed Managed Care Organization (MCO) tax renewal.
Focus on the lower revenue number for general fund, however, overlooks the fact that the May Revise actually proposes higher spending in 2023-24 than what was previously contained in the Proposed Budget in January. Looking at total state funds—both general fund and special funds—revenues in 2023-24 are $6.1 billion higher and total expenditures $9.6 billion higher.
| Total State Expenditures, 2023-24 Source: Department of Finance | |||
| ($ billion) | 2023-24 May Revise | 2023-24 January Proposed | Change from Proposed |
| Revenues | |||
| General Fund | $209.1 | $211.1 | -$2.0 |
| Special Funds | 73.0 | 65.2 | 7.8 |
| Total | $282.4 | $276.3 | $6.1 |
| Expenditures | |||
| General Fund | $224.1 | $223.6 | $0.5 |
| Special Funds | 79.5 | 70.4 | 9.1 |
| Total | $303.6 | $294.0 | $9.6 |
While recent reviews by Legislative Analysts’ Office (LAO) conclude that general fund revenues will likely come in another $11 billion lower and general fund expenditures $10 billion higher than the May Revise estimates, the numbers in the table are a clear example of how focusing only on the general fund misses the total state tax burden coming from the state. Special funds composed of dedicated taxes and a wide range of fees are a substantial and growing portion of that take.
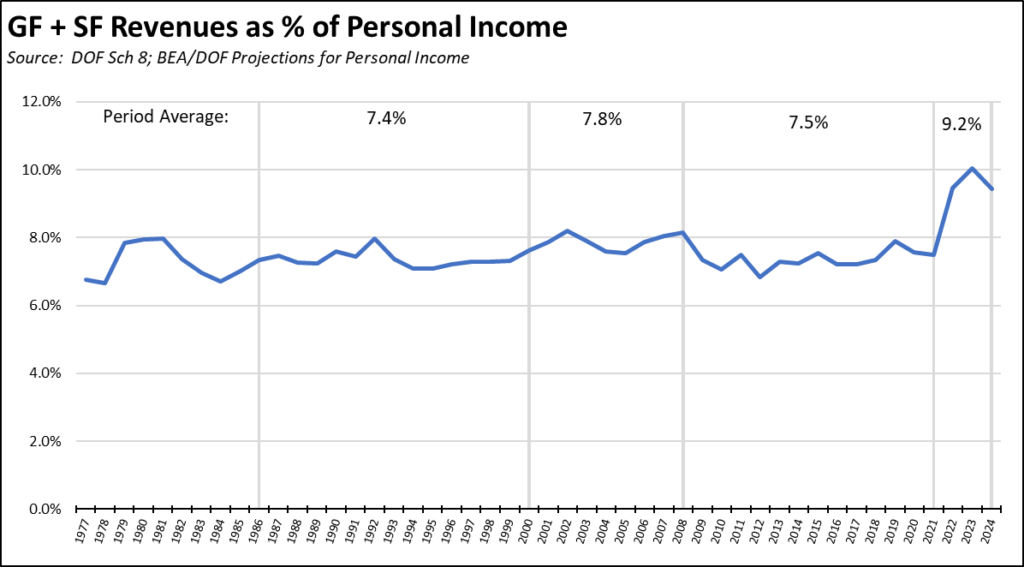
Borrowing and expanding on a previous analysis by LAO, overall state expenditures—even incorporating LAO’s lower revenue estimate and recommended spending reductions—are still running not just above but well above historic levels. Total state expenditures (general and special funds) were relatively steady in the period prior to the current surplus conditions, averaging 7.9% of state personal income in the period FY 2000 to FY 2008 just prior to the Great Recession, and 7.3% in the period FY 2009 to the beginning of the pandemic period in FY 2021.
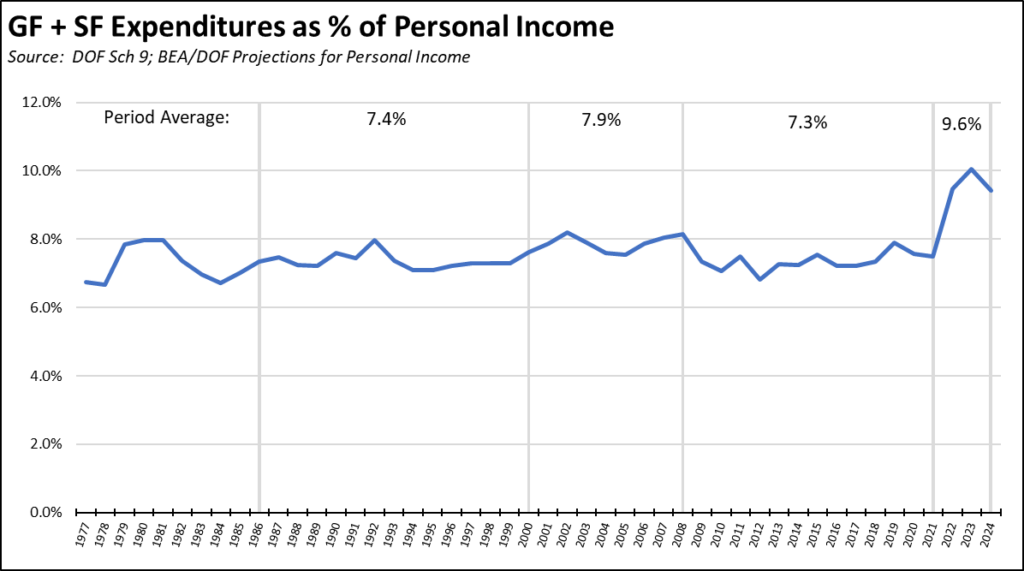
As predicted deficits quickly became historic surpluses during the pandemic, expenditures quickly followed. Using the May Revise numbers and Department of Finance economic projections, total state expenditures are expected to peak at 10.0% in the current FY 2023 and ease to a still elevated rate of 9.4% in FY 2024. Incorporating LAO’s recommended additional spending reductions into the May Revise numbers, total expenditures that year would still come in at an historically high of 9.2%.
The outer year budget problems—now called “deficits” in the LAO analysis—stem from these historic levels of spending. Looking at the flip side—revenues as a share of personal income—total state revenues also remain at historic highs, just not at the levels required to sustain all the proposed spending over an extended period of time. The May Revise skirts this issue by applying the $55 billion general fund balance built up in prior years, but a structural deficit in the May Revise numbers results in an ongoing annual deficit of about $15 billion in the multi-year forecast. The LAO numbers are somewhat higher.
The present budget situation is not one of deficit conditions. Viewed from this longer term perspective, total revenues remain high. The surplus amount just is not as large as previously estimated.
To a large extent, recent budgets have treated the current revenue upsurge appropriately, applying the surplus component largely to one time and limited term spending. However, LAO also estimates that ongoing baseline expenditures have increased by $11 billion in this period, and are expected to grow to $25 billion by FY 2026. Continued revenue pressures are likely to support this additional growth along with many of the current one time and temporary expenditures now under consideration for cuts. These revenue pressures, however, have to be considered from the perspective of how much the state contribution to the total tax burden—and its resultant effect on the cost of living in the state—has already soared in recent years.