Highlights for policy makers:
- California Lead in R&D Investments
- Early Benchmark Series Signals Only Marginal Revisions to California Jobs Data
- Disparate Regional Job Performance—California with Some of the Best and the Worst
- County Job Projections—More Stagnation Ahead
- Unemployment Insurance Claims Rise but Still Remain Below Prior Year Trends
California Lead in R&D Investments
One of the strongest competitive aspects of California is its dominance of R&D, accounting for just under a third of all US R&D in the latest data for 2023 as measured by value added (contribution to GDP). Reductions in federal R&D funding have been cited by a number of commenters as a potential threat to this underpinning of the state economy, yet federal funding accounts for only a small percentage of this activity. Instead, 90% of the state’s R&D comes from businesses spending their own funds, with smaller shares also coming from higher education, nonprofits, and state and local governments.
A more immediate and much larger threat to California R&D instead comes from the current proposal to substantially and permanently restrict use of corporate tax credits, a proposal that would primarily affect the R&D tax credit. While this proposal may materially affect only a small number of firms, as with most other aspects of state tax policy, tax changes do not have to have a broad application to have a broad economic and consequently longer term revenue effect. Combining the survey results discussed below along with other sources, an estimated 0.05% of California firms with 10 or more employees account for nearly two-thirds of California R&D. An estimated 0.15% accounts for over four-fifths.
The governor has previously touted research and development as one of the state’s leading economic strengths, citing R&D as “foundational to the success of our economy.” The data bears this out. From our previous post discussing a new data series from US Bureau of Economic Analysis, California generated 32.3% of national R&D value added (contribution to GDP) in 2023, largely stable from 32.0% in 2022 and down only slightly from the recent peak of 33.5% in 2020. On a value added basis, business R&D spending was the primary driver, comprising 93.3% of the state’s total in 2023, with higher education and nonprofits at 3.3%, state and local government 2.6%, and federal government only 0.8%.
Additional data on the importance of R&D to the state’s economy is provided by the annual surveys of R&D spending by NSF’s National Center for Science and Engineering Statistics. Using the most recent 10-year results, domestic R&D spending by companies in California from all fund sources grew by an average of 10.8% since 2013, compared to the rest of the US at 7.3% annually. In 2023, 93.3% of California business R&D spending came from their own funds, while 3.0% came from federal funds and 3.7% came from other sources. Overall, R&D spending by California businesses accelerated after 2018 and even remained strong during the pandemic years.
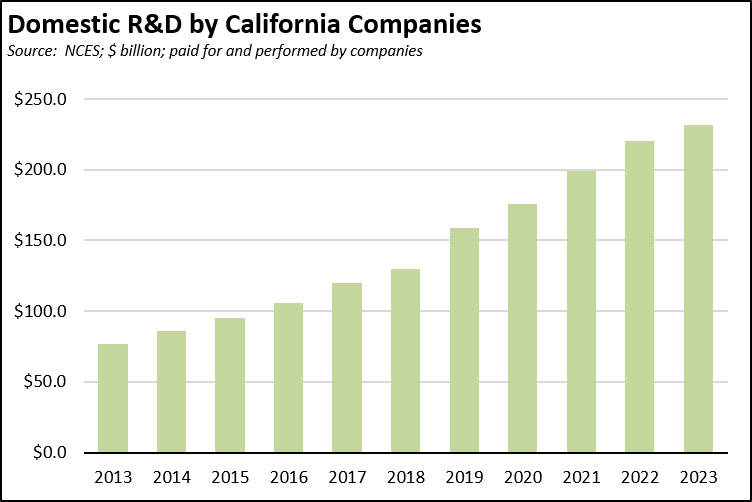
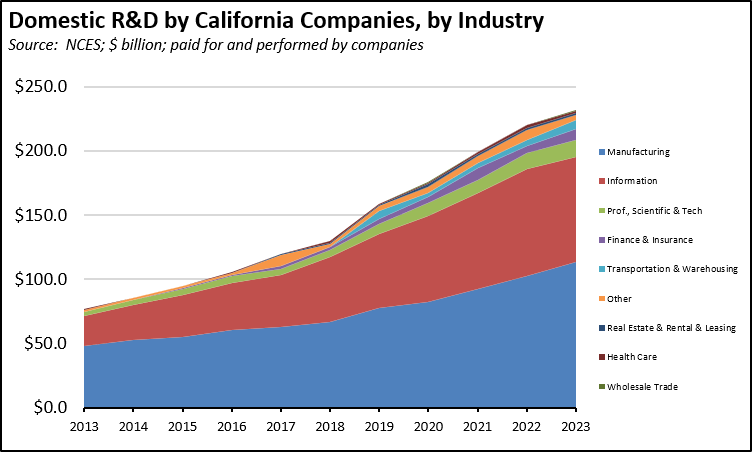
R&D is typically associated with the emergence of California as the center of the tech industry. Manufacturing, however, is the state’s leader in R&D investments, a factor essential to the state’s current—but receding—lead as the nation’s manufacturing center.
California’s share of business spending of their own funds on R&D has been relatively stable since 2019, ranging between 36.2% and the high of 37.0% in 2019. R&D concentration, however, varies widely by industry as shown by the selected industries in the following table. Note that all the table data and other data used in this report is prior to the imposition of limits on the R&D tax credits in 2024.
Overall, California retained the lead among the states by a wide margin. In 2023, California hosted 34.4% of all company domestic R&D (both own funds and from other funds), followed by Washington at 7.4%, Massachusetts at 7.3%, Texas at 4.9%, and New York at 4.8%.
The recent context in discussing California’s R&D prominence lies in contrasting the state’s economic success from this source to reductions in federal funds available for this purpose. While focusing on the federal component—which provides only 0.8% of the state’s R&D contribution to state GDP—this policy focus ignores the overwhelming portion that instead comes from companies spending their own funds. In fact, current budget proposals to restrict the R&D tax credit even further are likely to result in greater reductions in total R&D spending under the common sense adage that you get less of something if you tax it.
The May Revise proposes to cap corporate use of tax credits (excepting NOL) to a maximum of $5 million or 50% of pre-credit tax liability, whichever is greater. As discussed by LAO in their analysis of the proposal, these limits would primarily limit use of the R&D tax credit. LAO also estimates that the proposal would affect fewer than 100 corporate taxpayers. While undoubtedly true in the current circumstances, this conclusion misses the broader picture.
First, companies invest in R&D precisely under the expectation that by doing so they will be able to grow, perhaps not always to match the size of those 100 corporate taxpayers but certainly well on the way. Even if the proposed limits would not apply to their current operations, the expectation that they could eventually grow to where it would will lead many companies to at least consider moving those activities to one of the 36 other states offering a tax credit. This competitiveness issue has been easily grasped when discussing the film tax credit. It should be as clear when considering a similar situation affecting a much larger source of jobs and tax revenues.
Second, the proposed restrictions likely would affect a small share of the state’s companies precisely because a small share is responsible for the lion’s share of R&D spending. Note that in the table below, the number of firms engaged in R&D at each size level is available only for the US, but because the distributions are similar, they likely represent the situation in California as well. As indicated in 2023, 2.3% (5,000 employees or more) of the firms conducting R&D were responsible for nearly two-thirds of the total. Adding in the next size level, only 7.4% of these firms covered over four-fifths. And these shares apply only to firms performing R&D activities; the percentages become substantially smaller when applied to all firms.
The potential employment impacts are just as substantial. Based on the most recent 2025:Q2 data from EDD, firms with 3,000 or more employees make up only 0.3% of all California firms with 10 or more employees, yet they produce 24.9% of all wage and salary jobs. Firms with 1,000 or more employees are only 0.7% yet provide 37.0% of all wage and salary jobs. As in many other areas of state tax policy, a measure does not have to have broad application to have significant risks to the state economy and revenues.
Early Benchmark Series Signals Only Marginal Revisions to California Jobs Data
As we have discussed in the past, the job numbers released by Employment Development Department and Bureau of Labor Statistics are modeled estimates based on monthly surveys. These estimates are then revised annually relying heavily on the actual job counts contained in the Quarterly Census of Employment & Wages (QCEW) that cover about 98% of jobs along with other sources.
As the QCEW data is released quarterly, the likely revisions it signals are tracked by the Philadelphia Federal Reserve Bank under their Early Benchmark series, using the same revision procedures applied by BLS to both the state and national numbers.
The most recent accounting from the 2025:Q4 data indicates that at least to date, California is likely to see only minor changes in the current job estimates in the annual revisions to be released early next year. The monthly estimates currently show nonfarm jobs rising by 0.3% in 2025. The Early Benchmark revisions would raise this result only marginally to 0.4%.
Looking at the 5 top job producers since the beginning of the pandemic, the same outcome of only marginal revisions is indicated for most of them. Florida is the exception, and is expected to show a more significant upward revision in its estimates.
Disparate Regional Job Performance—California with Some of the Best and the Worst
While California’s job picture largely stagnated in 2024 and 2025, there are substantial variations around the state. This pattern is shown in the following tables that rank the nation’s urban areas (metropolitan statistical areas—MSAs) by net jobs growth since the pre-pandemic peak in February 2020.
California shows its disparate job performance by having one MSA in the Top 10 (Riverside-San Bernardino-Ontario) and two in the bottom 10 including the worst performing MSA overall, San Francisco-Oakland-Fremont.
The results also show that a single MSA (Dallas-Fort Worth-Arlington) by having a net jobs expansion of 503,900 performed better than the entire state of California, which posted a 498,800 jobs gain in this period.
San Diego along with 14 other primarily interior MSAs have experienced positive growth, while 10 primarily higher cost coastal regions have shown negligible or negative jobs change. Of more critical importance to the overall state job performance are the results from its two largest regions.
As we have discussed in the past, the poor results for San Francisco-Oakland-Fremont MSA are less important to the state’s overall jobs picture but are critical to the health of the state budget. Especially as stock-based compensation has become the dominant factor in whether the state’s tax withholding receipts perform better or worse than projected and capital gains to revenue performance overall, jobs coming from especially Tech in this region have become a key indicator in the future course of state revenues.
Los Angeles is more critical to the overall state jobs outcome. Containing a quarter of the state’s nonfarm jobs and serving as a key center for manufacturing, trade, entertainment, and other industries, continued weak performance in this region has a more substantial dampening effect on the state’s overall performance. San Francisco and the rest of the Bay Area have an outsized effect on state revenues. Los Angeles and the rest of Southern California have a greater effect on the status of middle class wage jobs and the ability of California households to weather California costs.
County Job Projections—More Stagnation Ahead
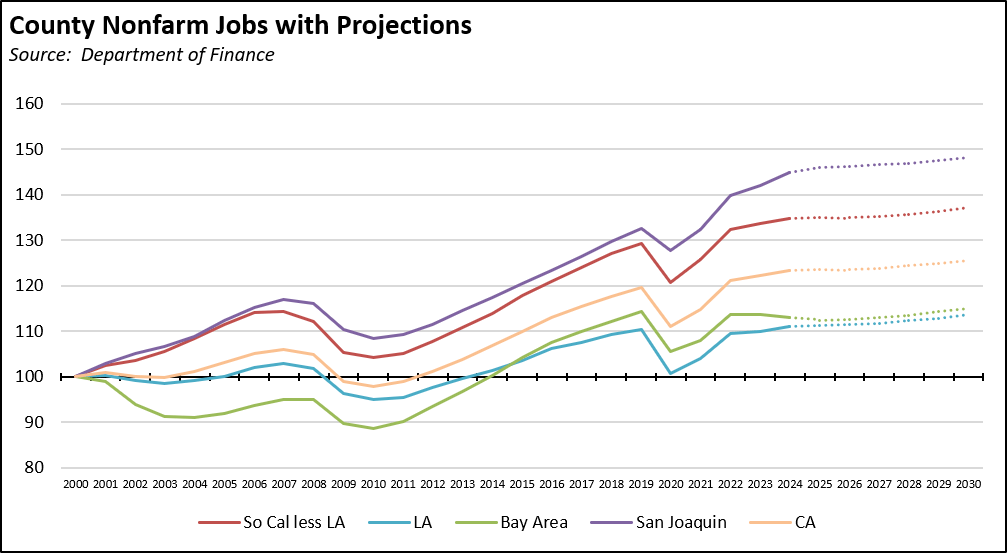
The drag of these two regions is further seen in the county-level projections recently released by Department of Finance. Overall, the Finance May Revise projections do not expect positive jobs growth in the state until 2028. Growth after that period is largely projected to be balanced between Los Angeles, the rest of Southern California, and the Bay Area but with little change in the San Joaquin Valley and other regions of the state.
Unemployment Insurance Claims Rise but Still Remain Below Prior Year Trends
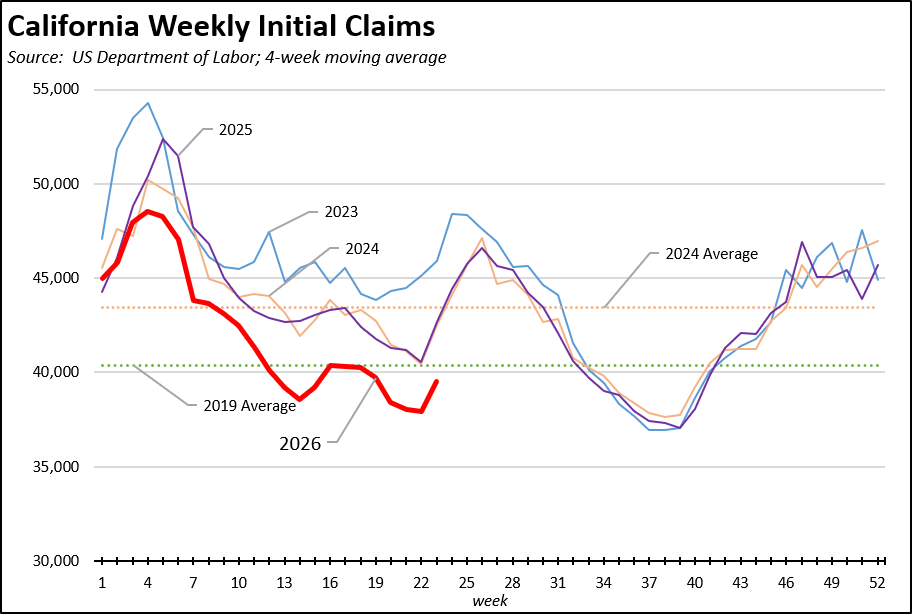
The most recent initial claims data shows a jump in keeping with previous seasonal trends. Over all, however, initial claims on a 4-week moving average basis remain below the trends from the previous 3 years.
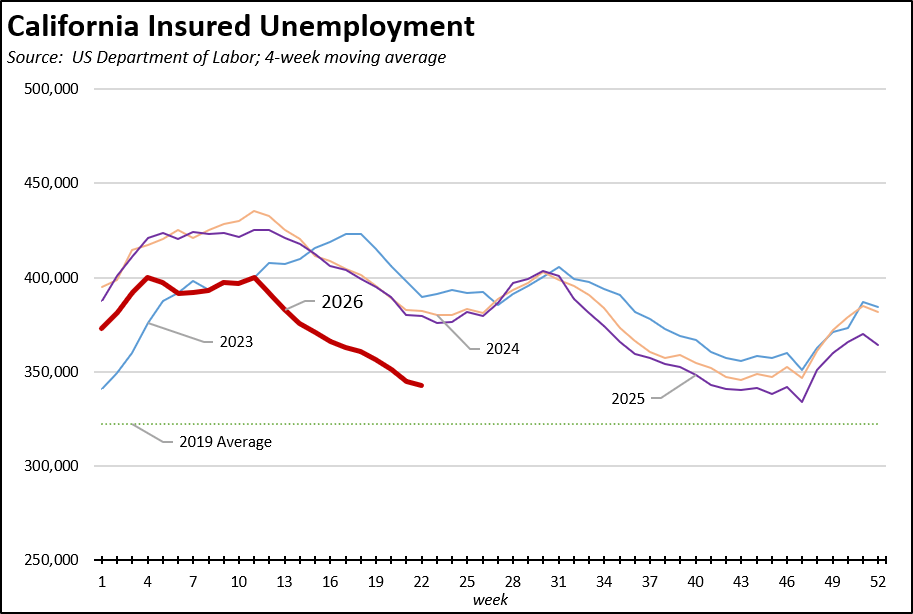
Insured unemployment—a proxy for continuing claims—also shows a decline from recent years but is consistent with prior year seasonal trends.
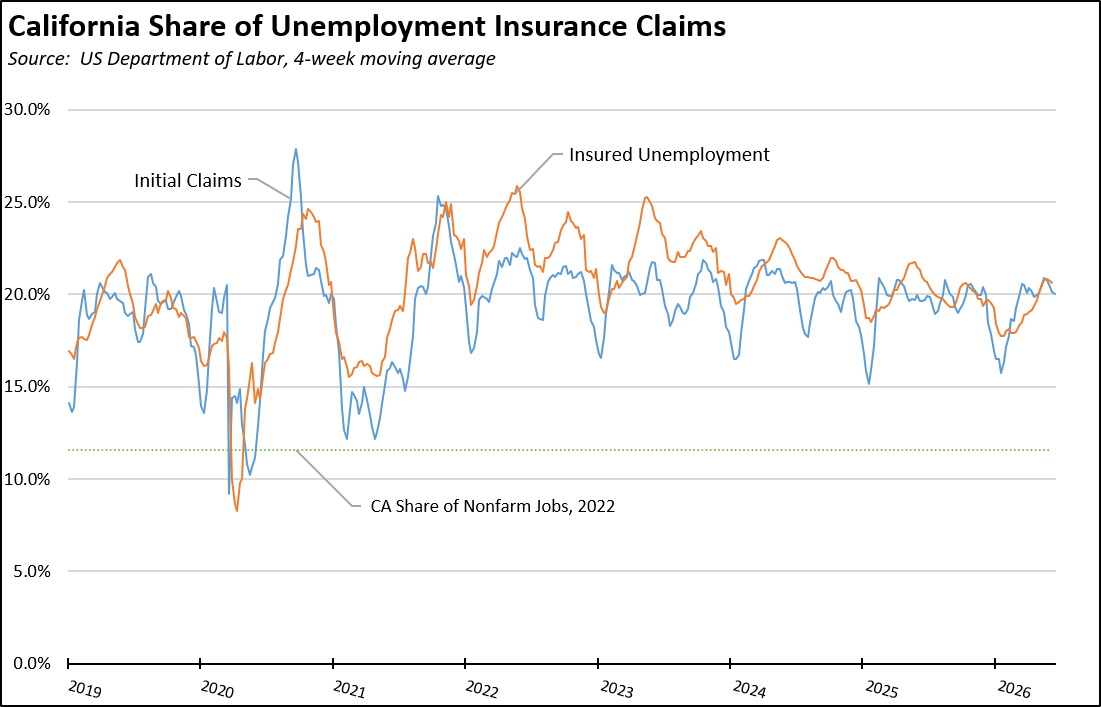
The same results largely are reflected in the national data as well. As a result, California continues to have an outsized use of this support program, constituting about a fifth of the national caseload whether measured by initial claims or insured unemployment.
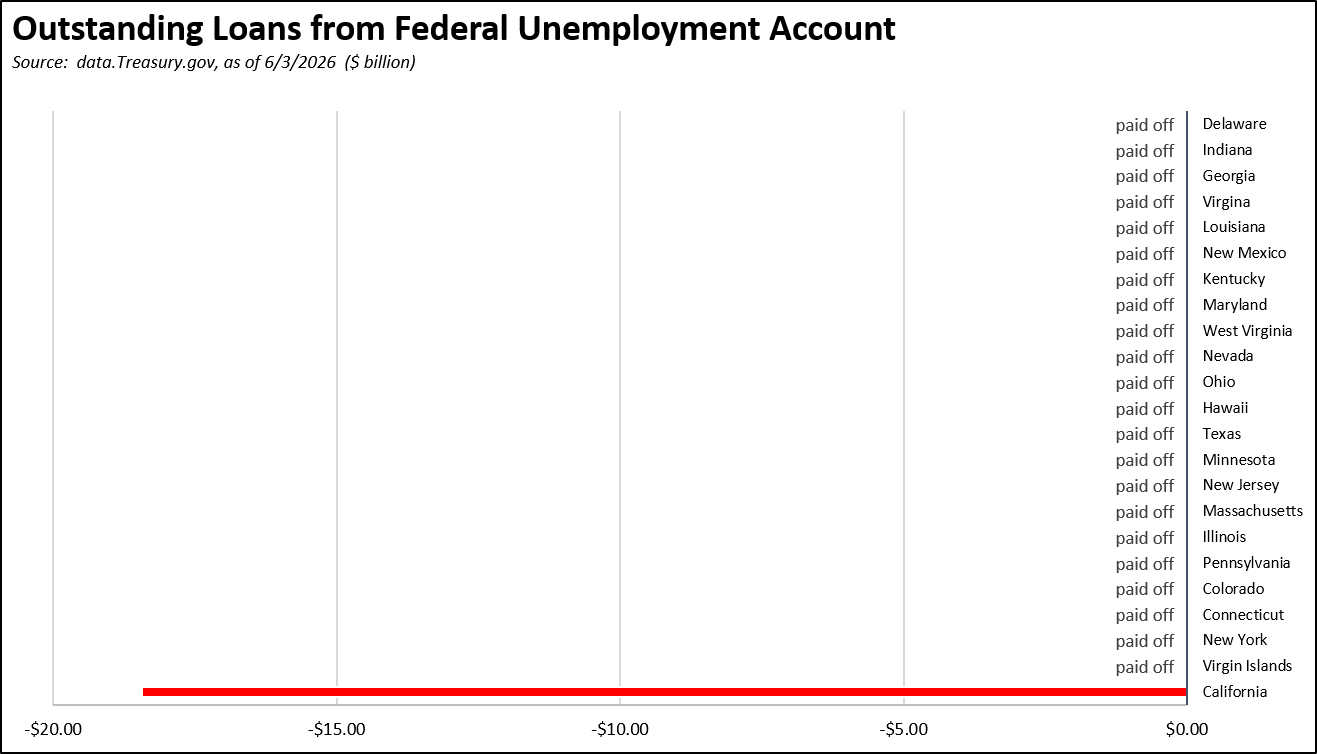
Yet in spite of practices that make this program a staple for such a relatively larger portion of the state workforce, the state continues to ignore the functional bankruptcy of the state fund. In the latest data, California remains the only state with debt carried over from the pandemic period despite being given federal funds specifically marked for payment of this debt. In the most recent accounting, California owes $18.44 billion, only somewhat lower than the $21.9 owed at the peak (February 2025) since the state reopened after COVID.
In its most recent projection, EDD expects little change in the overall health of the fund. The deficit is expected to grow to $22.0 billion at the end of 2026 (compared to $21.7 billion at the end of 2025 and $21.6 billion at the end of 2024), and ease only to $21.4 billion at the end of 2027. These outcomes are spite of a $1.6 billion tax increase ($2.0 billion in 2027 and growing) businesses now pay through the federal penalty as the result of the state’s inaction on this critical support fund.