The Center for Jobs and the Economy has released our full analysis of the December Employment Report from the California Employment Development Department. For additional information and data about the California economy visit www.centerforjobs.org/ca.
Highlights for policy makers:
Overview
In a somewhat different format, our Full Jobs Report for December provides an overview of California’s economic performance in 2024. The data is presented in two series: (1) outcomes in the last 12 months (or 4 quarters where applicable) for California and (2) longer term results beginning with the pre-pandemic year of 2019. Each chart indicates the time period covered by the indicator, with complete 2024 data available in some instances and partial year results or even only 2023 results available in particular for some of the broader economic measures such as state GDP. In cases where the December monthly data used, the 2024 results are preliminary.
To provide a comparison base, the state results are shown in relation to the national results for each indicator. Wherever possible, these are shown comparing California to the aggregate total for the other 49 states (plus DC) to avoid the influence California has on the national averages due to its size. In some cases, however, only comparisons to the US total are possible due to the nature of the data.
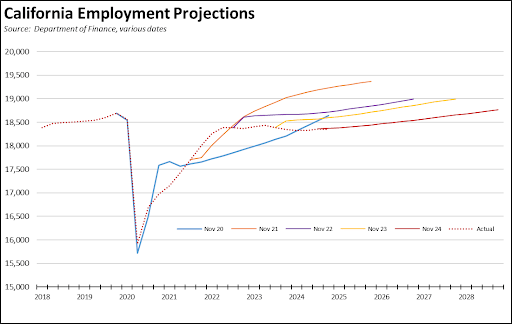
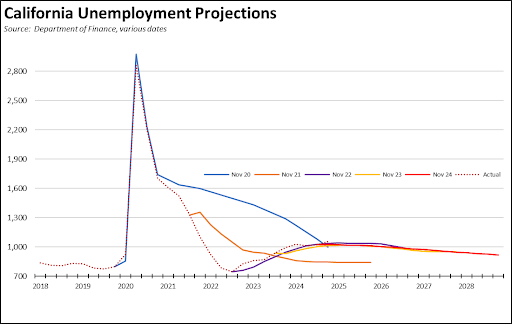
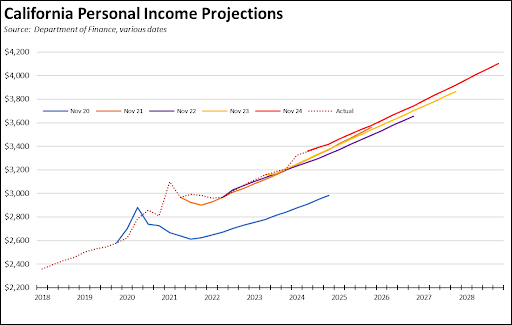
Overall, the data shows that California’s economy continues to slow relative to the rest of the country. These conditions are reflected in the Department of Finance economic projections undergirding the budget’s revenue numbers. Comparing the projections over the past five budget cycles, the earlier more optimistic projections underlying the rapid expansion in state spending have been replaced by progressively more moderate expectations. These projections are completed each November in preparation for the Proposed Budget in January. They are then updated every April for use in the May Revise.
Projections
In the latest edition (Nov 24), the Proposed Budget expects jobs growth of only 0.8% in 2025, slowing to an average annual rate of 0.7% in the following three years.
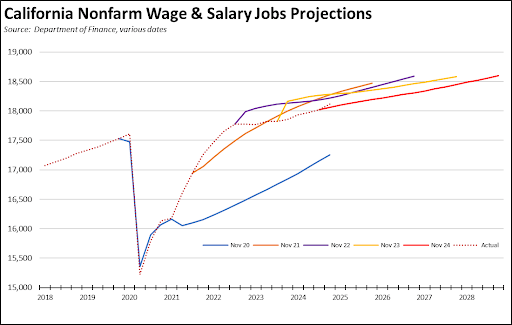
Employment is expected to grow even slower, at 0.4% in 2025 and an average of 0.6% in the following three years. At this rate, the number of employed workers in the state’s economy would not return to pre-pandemic levels until Q2 2028.
Similarly, high levels of unemployment are expected to persist, remaining above 1 million and dipping only 0.4% in 2025, but improving at an annual rate of 3.0% in the following three years.
In contrast, projections for total Personal Income have increased, although largely reflecting previously unexpected inflation and the state budget’s continuing overreliance on Tech industry compensation levels. Personal Income is expected to grow 4.2% in 2025 and at an average of 4.7% in the following three years. Inflation, projected at an average annual rate of 2.6% in this period as measured by the California CPI, makes up a substantial portion of that growth. In addition, these projections were made prior to several recent events. The Los Angeles fires will have some but more likely temporary effect on Personal Income, unless the affected high-income households react to this event by increasing migration from the state. The recent DeepSeek-driven uncertainty in Tech stock prices will have a more immediate budget effect due to its impact on both budget-critical capital gains and withholding on equity-based compensation in this industry.
While the component indicators such as nonfarm jobs illustrate the extent to which the state’s economy is slowing particularly in relation to the rest of the US, some of the broader indicators such as Real GDP are more positive. For example, between Q3 2018 and Q3 2024, California’s Real GDP expanded by 17.8% compared to total US growth that was somewhat lower at 15.4%. However, this outcome relies solely on California’s share of High Tech industries. The two sectors containing most of the High Tech activity (NAICS 45 Information and NAICS 60 Professional, Scientific & Technical Services) produced 61.4% of total California growth in this period while covering only 39.8% for the US as a whole. California is overly dependent on a single industry. Growth in the rest of the US is more diversified and produces a broader range of jobs and wage levels.
Much of this difference is also continually eroded by the state’s high and growing costs. Again using GDP as the example, California remained the 5th largest economy in 2023 based on GDP measured in nominal. Using the cost-adjusted series, California dipped to only 12th largest behind Italy.
Jobs
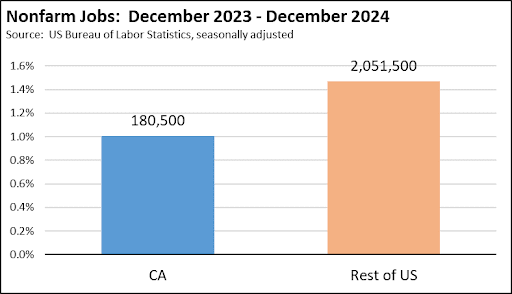
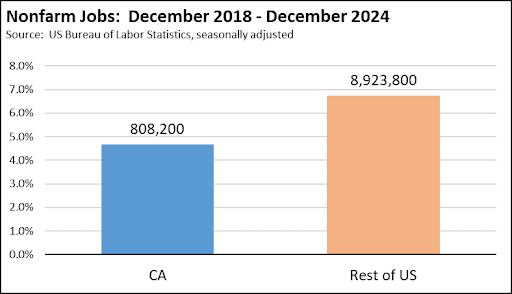
Nonfarm Jobs grew 1.0% (seasonally adjusted) over the year, while expanding faster at 1.5% in the other states. Compared to December 2018, nonfarm jobs in California grew by 4.7%, while expanding faster in the other states at 6.7%.In December 2018, California contained 11.6% of the nation’s nonfarm jobs. In December 2024, this share notched down to 11.4%.
The job numbers for California, however, may be revised significantly lower in the upcoming annual data revisions in March. The early estimates from the Philadelphia Federal Reserve Early Benchmark Revisions expect California’s total through the first half of the year to be lowered by 172,000, potentially erasing virtually all of the estimated jobs growth in 2024.
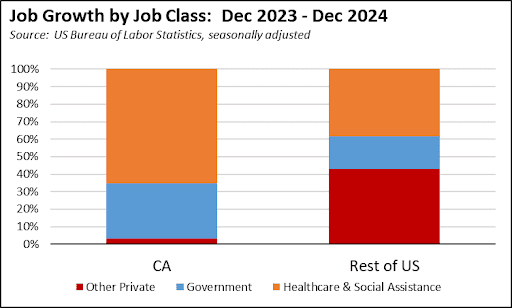
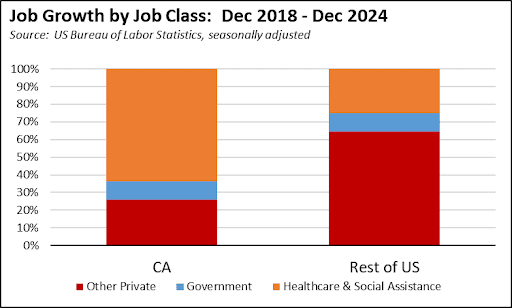
Jobs by Class indicates jobs growth in California has become overly dependent on government spending while high taxes, regulations, and costs are crushing its traditional entrepreneurial base in industries other than Tech. The state’s jobs growth comes predominantly from government and government-dependent (Health Care & Social Assistance) sources. All other private industries produced only a net 6,000 jobs in the state in 2024, while expanding 2.1 million in the rest of the US. Since December 2018, California produced only a net 209,000 jobs in the other private industries, compared to 5.8 million in the rest of the US.
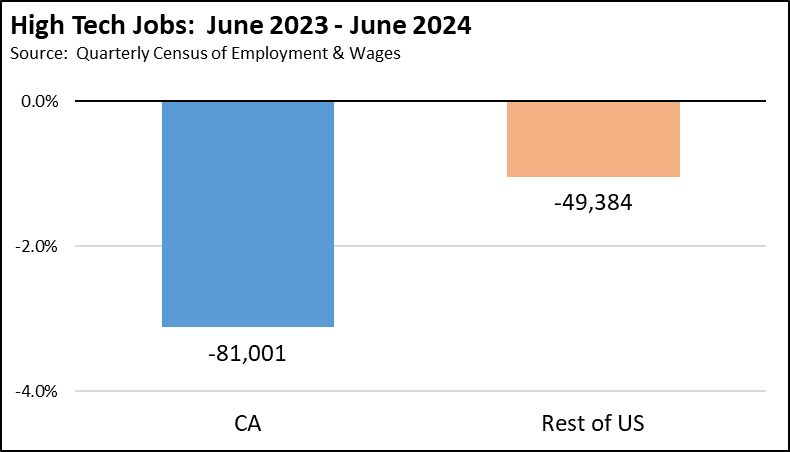
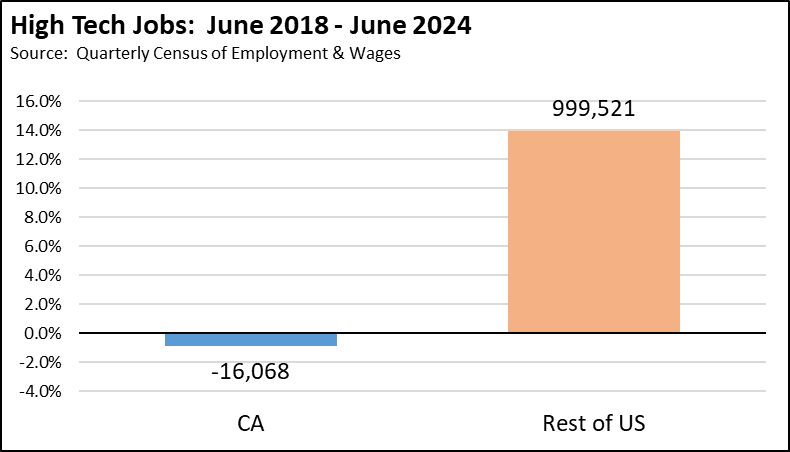
High Tech jobs continued their decline in the state, dropping 3.1% between June 2023 and June 2024 while easing only 1.0% in the rest of the US. Compared to July 2018, high tech jobs were essentially unchanged, dipping only 0.9%, while growing 13.9% in the rest of country as the knowledge component diversified into other urban centers and as the manufacturing component growth shifted to the Southeastern and Intermountain states. In 2018, California had 20.0% of the nation’s High Tech jobs. In 2024, this share dropped to 17.9% as the industry diversified geographically.
The Center’s definition of High Tech industries was detailed in our January 2021 Jobs Report. The component industries since have been modified to conform to changes in the NAICS industries by Bureau of Labor Statistics (especially elimination of Electronic Shopping & Mail-Order Houses (NAICS 4541)), and the inclusion of Computer and Electronic Product Manufacturing (334), Aerospace Product & Parts Manufacturing (3364), Medical Equipment & Supplies Manufacturing (3391), and Battery Manufacturing (33591) to conform to our more recent analyses on this industry.
Data for this indicator and the following industries was taken from the Quarterly Census of Employment & Wages (QCEW) given the current divergence between that series and the monthly job estimates. As indicated, the monthly estimates will be revised in March, while the QCEW data is an actual count of jobs from employer tax filings and forms the basis for those revisions.
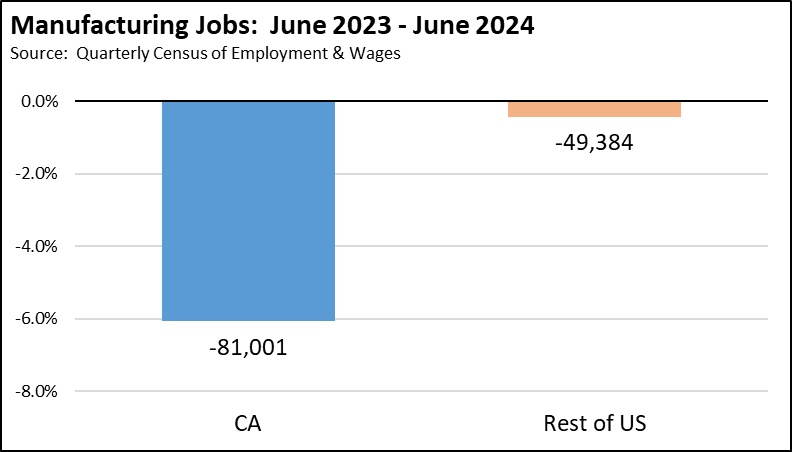
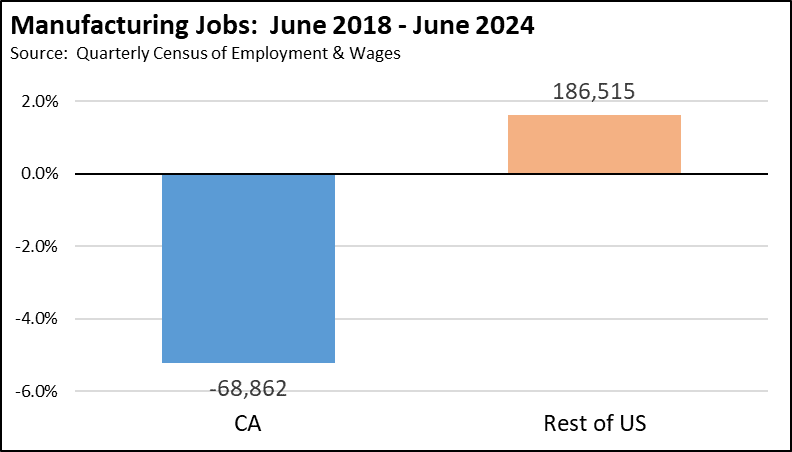
Manufacturing Jobs fell 6.1% between June 2023 and June 2024, while essentially staying level in the rest of the US with a loss of only 0.4%. Compared to June 2018, manufacturing was off 5.2% in California while growing 1.6% in the rest of the US as manufacturing continues its shift to the Southeastern and Intermountain states. California—specifically the Los Angeles Region—remains the largest manufacturing center in the US, but the state’s share of manufacturing jobs continued falling from 10.4% in 2018 to 9.8% in 2024.
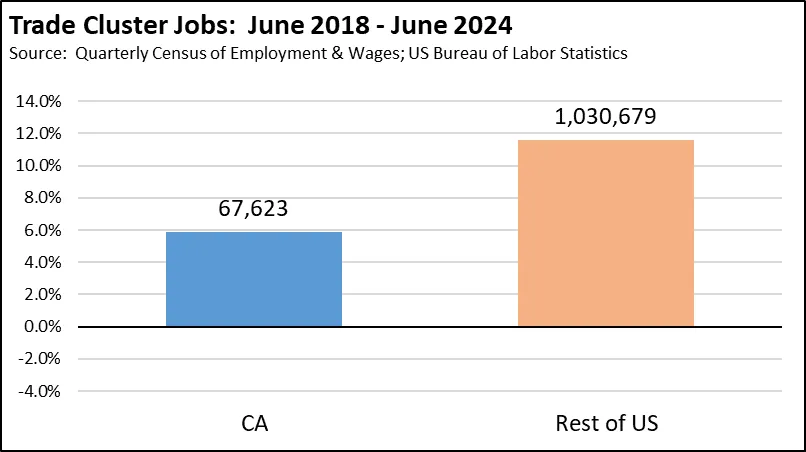
Trade Cluster Jobs were little changed in 2023, both in California and the rest of the US. These jobs, however, likely increased somewhat in California during the second half of 2024 due to labor uncertainty at the Eastern and Southern ports and in Canada, and as shippers accelerated traffic in anticipation of potential tariff changes.
Compared to June 2018, California saw these jobs expand by 5.9%, while growing 11.6% in the other states as ports in particular along the Gulf and Atlantic coasts invested heavily in port and intermodal expansions. California contained 11.5% of Trade Cluster jobs in 2018, but dropped to 10.9% in 2024 as trade flow competition increased from other states. Still, these California jobs provide a blue collar, middle class wage jobs base essentially equal to the level of manufacturing in terms of both number of jobs and wages. However, they face a number of threats from pending state and local regulations that could undermine the state’s competitiveness by raising the costs of trade flows through the state and that could impose de facto caps on that trade activity and the associated jobs.
The Center’s definition for Trade Cluster jobs is the same as developed by the Los Angeles Economic Development Corporation and as used in other Center reports.

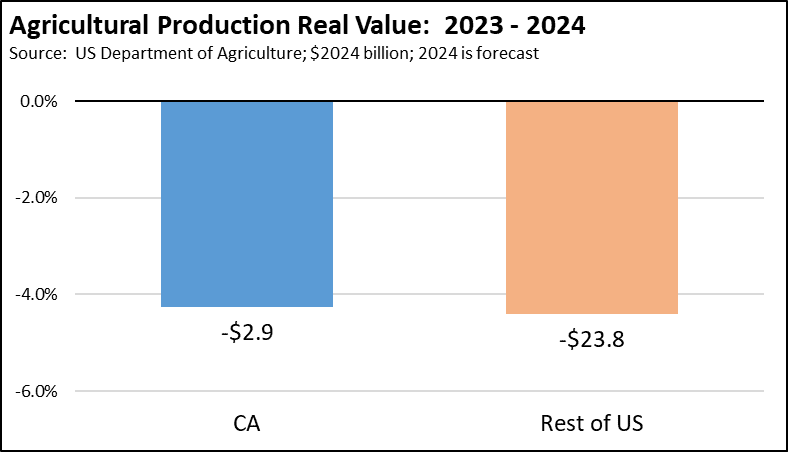
Agriculture in real terms ($2024) is expected to contract about the same across the country, with the real value of agricultural production dropping 4.3% in California in 2024 and 4.4% in the other states.
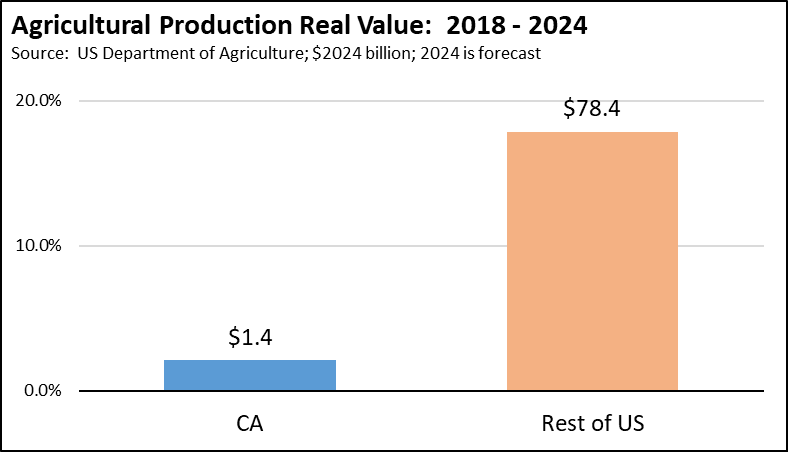
Since 2018, real production value has grown 17.9% in the other states while showing little change (2.1%) here as California farmers have faced growing costs of operation and growing restrictions on water supply. While California remains the largest agricultural producer, the state continued to see its overall share drop, going from producing 12.9% of the nation’s food and fiber in 2018, to 11.3% in 2024.
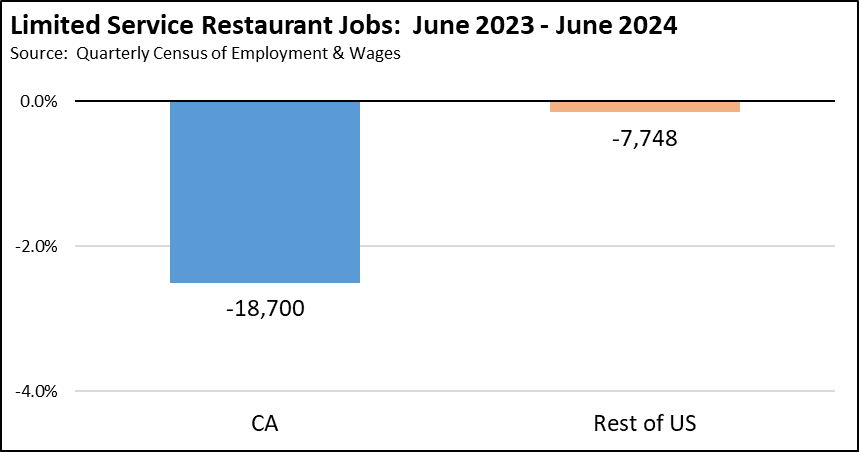
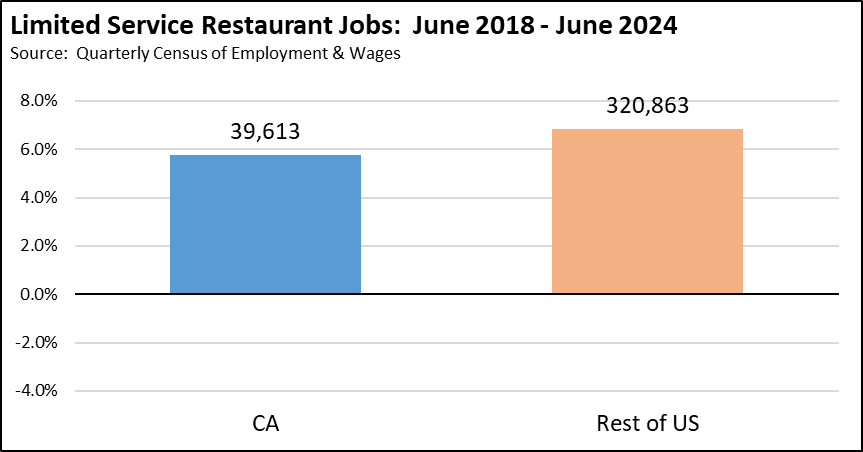
Limited Service Restaurant Jobs dropped 18,700 (-2.5%) in 2024 as this industry adapted to new state law requiring a $20 minimum wage for fast food chains. Jobs in the rest of the US were essentially unchanged, showing a dip of only 0.2%. This industry had been growing, with a net gain of 5.8% since 2018, while growing somewhat faster at 6.8% in the rest of the US due to higher population growth.
The data in the charts covers the three constituent QCEW industries equivalent to the monthly estimates for Limited Service Restaurants: Limited Service Restaurants (NAICS 722513), Snack and Nonalcoholic Beverage Bars (722515), and Cafeterias, Grill Buffets, and Buffets (722514).
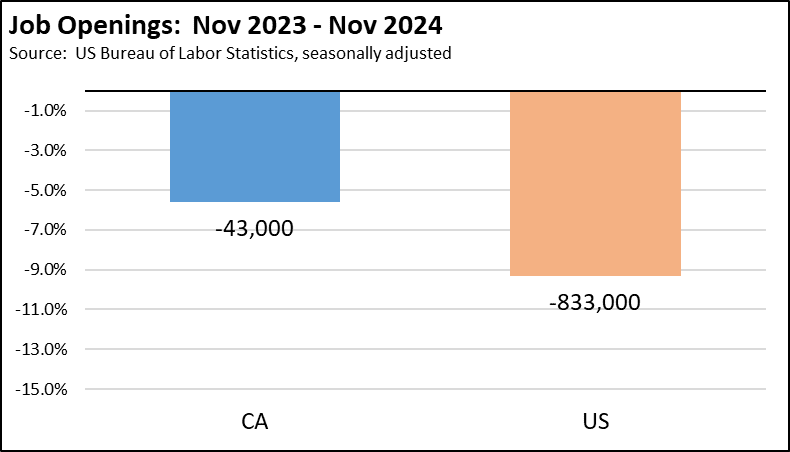
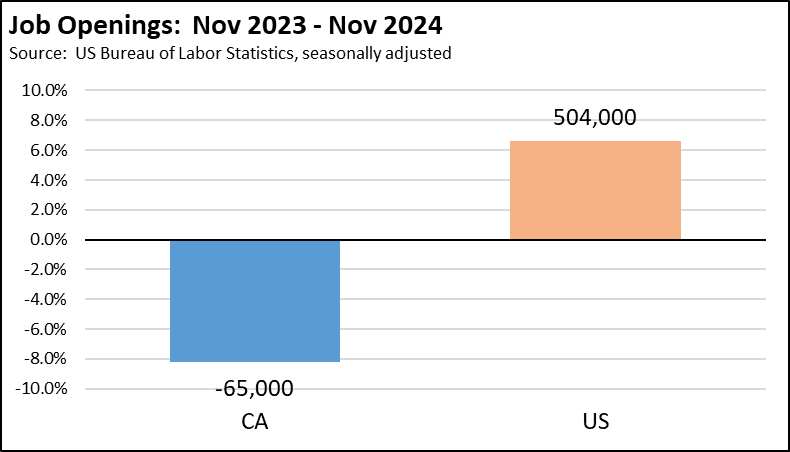
Job Openings fell to a lesser extent over the year ending November 2024 due to a reversal in the state’s trend in the November data. California job openings were down 5.6% for the year, while falling 9.3% in the US total.
The California results still were lower than the pre-pandemic levels, with California job openings off 8.2% compared to November 2018 but the US total showing a 6.6% gain.
Job openings at the end of each month represent the additional jobs potential within the state at least in the short to intermediate term. As employers have cut back on their hiring plans in California, the state’s openings have gone from 10.4% of the US total in November 2018, to 8.9% in November 2024.
This jobs potential is also a critical element in the state’s ability to reduce its persistently high unemployment levels. In November 2018, California had 1.1 unemployed workers for every available job opening. In November 2024, this ratio sank to 1.5 unemployed workers for every available opening, the worst rate among the states and DC. In contrast, the overall US level in November 2024 was 0.9, indicating overall that employers elsewhere in the US were still looking to hire more workers than what the labor force was currently providing.
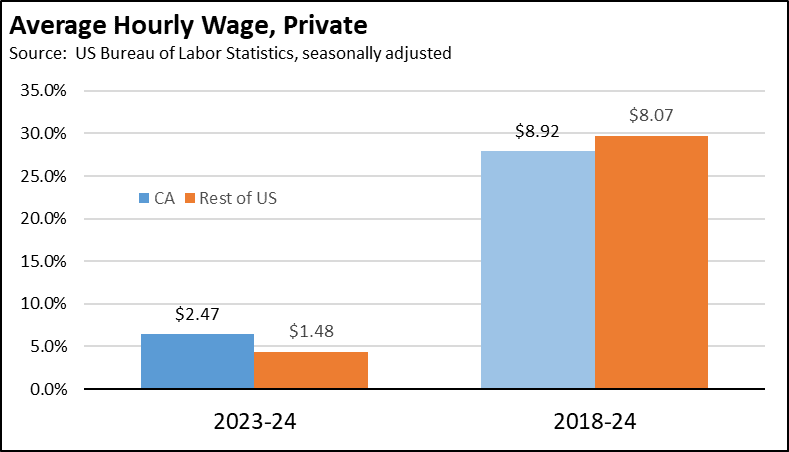
Average Hourly Wage for private workers rose 6.4% ($2.47) in nominal terms in California in 2024, somewhat higher than the 4.4% raise ($1.48) for private workers in the rest of the country. Since 2018, private California workers saw wages rise 27.9% ($8.92), only somewhat lower than the rest of the US at 29.7% ($8.07).
In 2018, the California average hourly wage was 17.8% higher than in the rest of the US. In 2024, it was 16.2% higher.
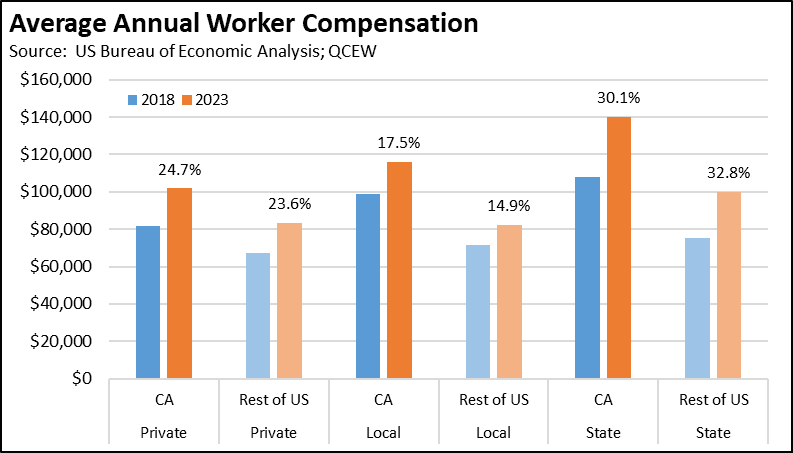
Wages, however, only comprise a portion of worker remuneration with total compensation now being a more important consideration. Average compensation (combining hours, wages, and benefits) for California state workers grew the fastest at 30.1%, compared to private workers at 24.7%. In 2023, state government compensation was 40% higher than the rest of the US, local government 41% higher, and private workers 22% higher, all of which only saw minor changes from the ratios in 2018.
Average compensation in California for state workers was 38% higher than for private workers in 2023 compared to 32% higher in 2018, while local government workers ranged lower at 14% and 21% higher, respectively.
Compensation as shown in the chart covers wages and salaries, pensions, insurance, and employer contributions for government social insurance (e.g., Medicare). It does not include differences in other benefits such as paid time off and holidays.
The Bureau of Economic Analysis discontinued one of the series previously used to calculate the average compensation by industry indicator. Data since 2020 instead is calculated using BEA data and the QCEW.
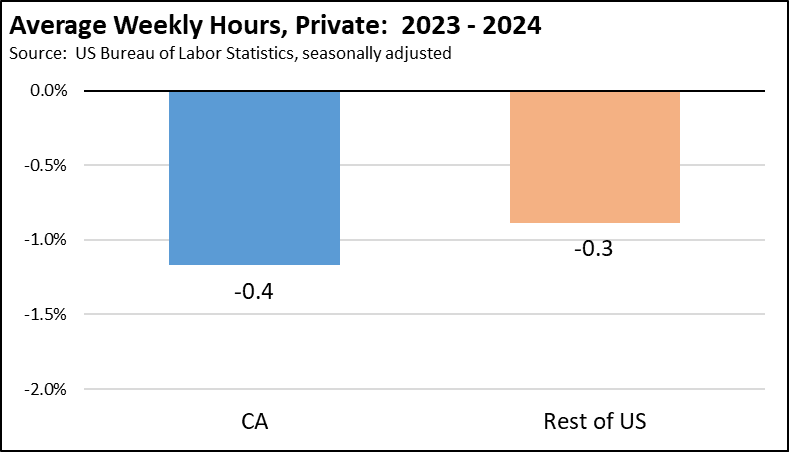
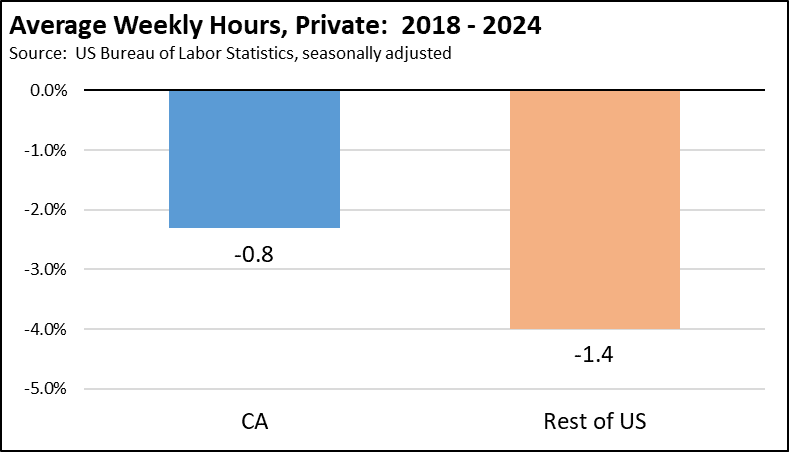
Average Weekly Hours for private workers offset a portion of the hourly wage gains, with California easing 1.2% (0.4 hour) and the rest of the US by 0.9% (0.3 hour) between 2023 and 2024. Since 2018, California private workers saw their average weekly hours fall by 2.3%, while private workers elsewhere in the US saw a 4.0% contraction.
There was relatively little change in the overall ratios. The average weekly hours for private workers were 1.2% lower in California than in the rest of country in 2018. At 33.8 hours, California was only 0.6% higher in 2024.
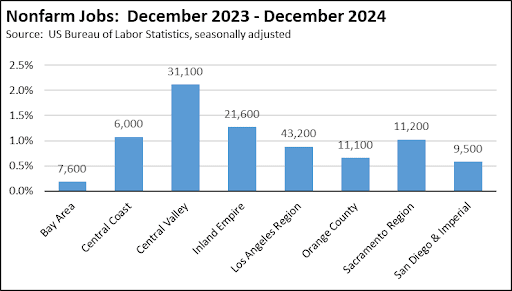
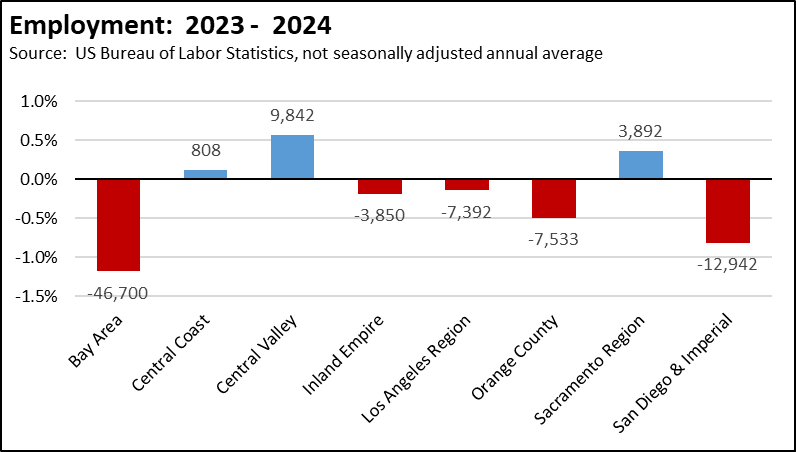
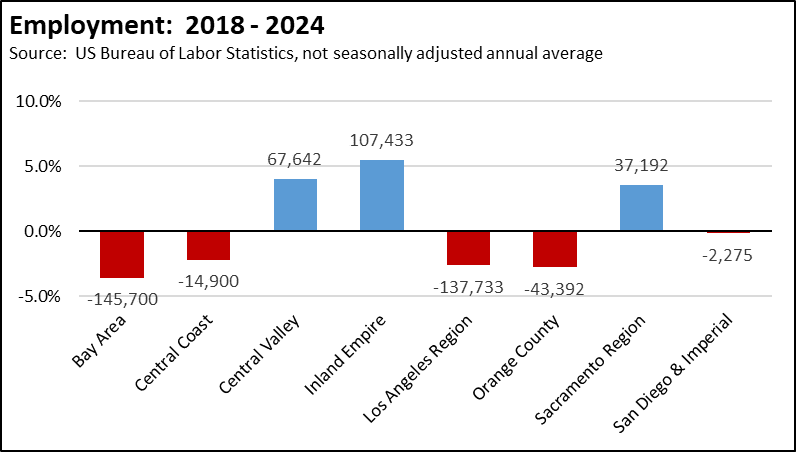
Nonfarm Jobs by Region show the strongest growth in the lower cost interior regions, while both Los Angeles and the budget critical Bay Area regions largely reflect population losses to other states and other regions during the pandemic. San Diego/Imperial is the primary exception to this overall trend, but even this region experienced a slowing relative to the other parts of the state over the last year.
Labor Force
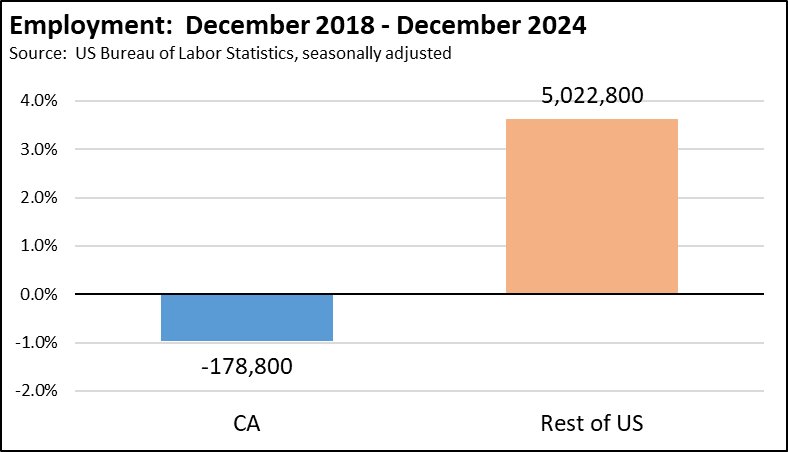
Employment changed little in California over the year, dipping 0.1% while growing 0.4% in the rest of the US. Compared to December 2018, the number of employed workers in California was down 1.0%, while employment grew 3.6% in the rest of the nation. As a result, California’s total share of employed workers dropped from 11.8% in 2018 to 11.3% at the end of 2024.

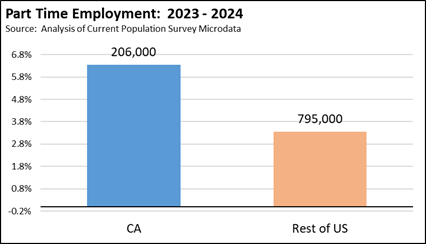
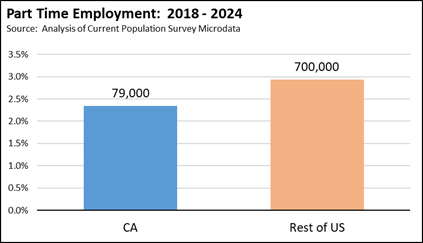
Part Time Employment among employed workers grew faster in 2024, at 6.3% in California compared to 3.3% in the rest of the US. Since 2018, however, the rise has been similar at 2.3% in California and 2.9% in the rest of the US. California has a higher incidence of part time jobs. The state contained 12.4% of part time workers in 2018—somewhat higher than its overall population share of 11.6%—and nearly the same at 12.3% in 2024.
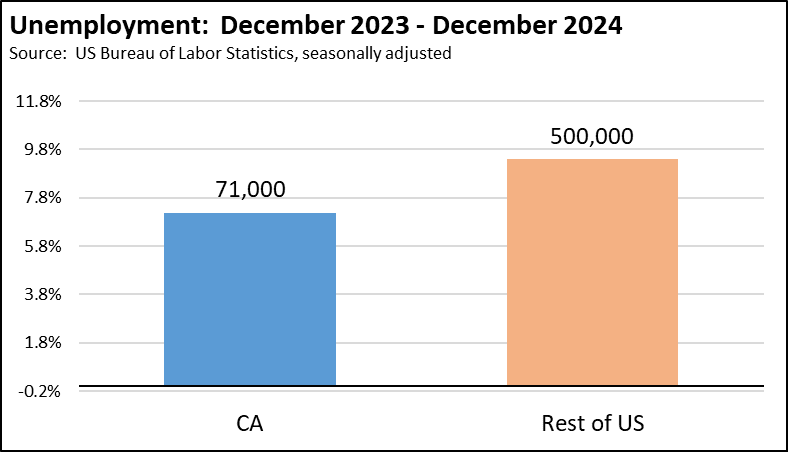
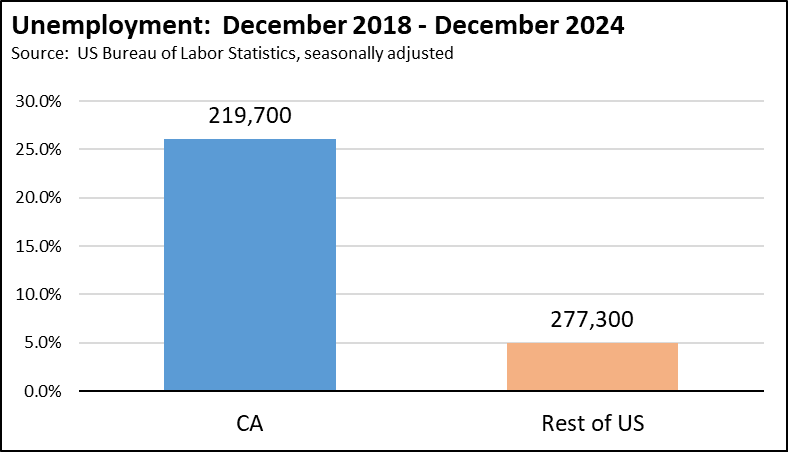
Unemployment grew somewhat slower in California in 2024, rising 7.2% while growing 9.4% in the rest of the US. Longer term, the number of unemployed soared 26.1% since 2018 vs. only 5.0% in the rest of the nation, and in absolute numbers nearly matched the rise in the other states and DC combined. The number of unemployed workers in California remained above the 1 million mark throughout 2024, with California going from 13.2% of the nation’s unemployed in December 2018 to 15.4% in December 2024.
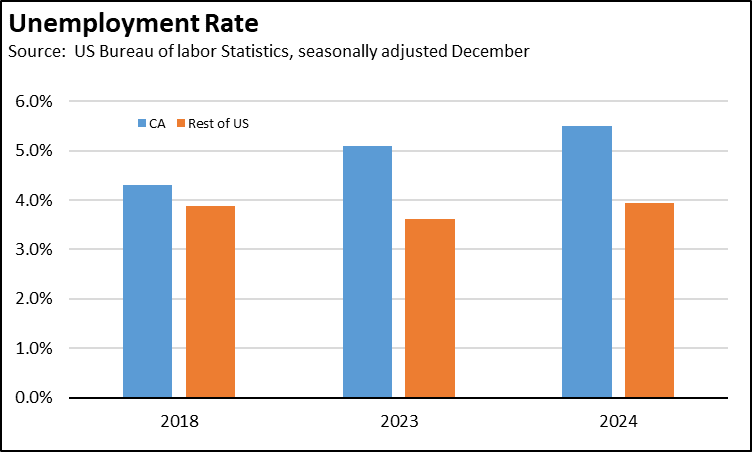
Unemployment Rate has remained higher in California due to its persistently high number of unemployed. However, in December 2018, California’s unemployment rate was only 11% higher than the rest of the US. In December 2024, it was 40% higher. In December 2018, California had the 12th highest unemployment rate among the states and DC. In December 2024, California tied with DC for the 2nd highest.
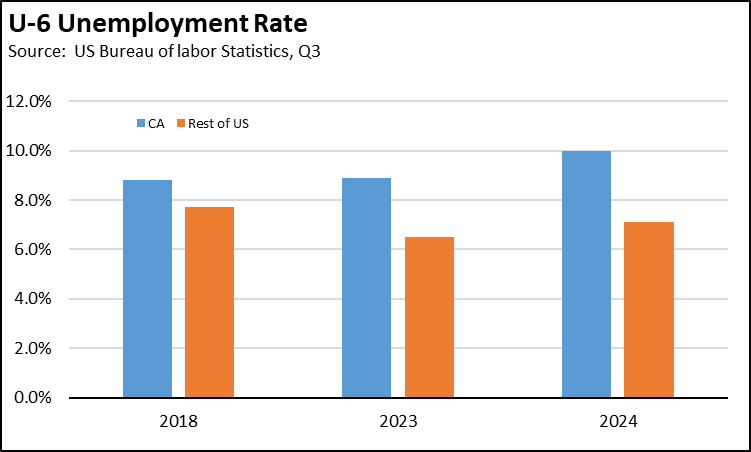
The monthly unemployment rate, however, only covers persons actively looking for work. U-6 is a broader measure of underemployment covering unemployed, part time employed for economic reasons, and persons marginally attached to the labor force. California’s U-6 rate similarly has diverged from the rest of the nation, going from 14% higher in Q3 2018 to 41% higher in Q3 2024. In Q3 2018, California had the 9th highest U-6 rate among the states and DC. In Q3 2024, it was the highest.
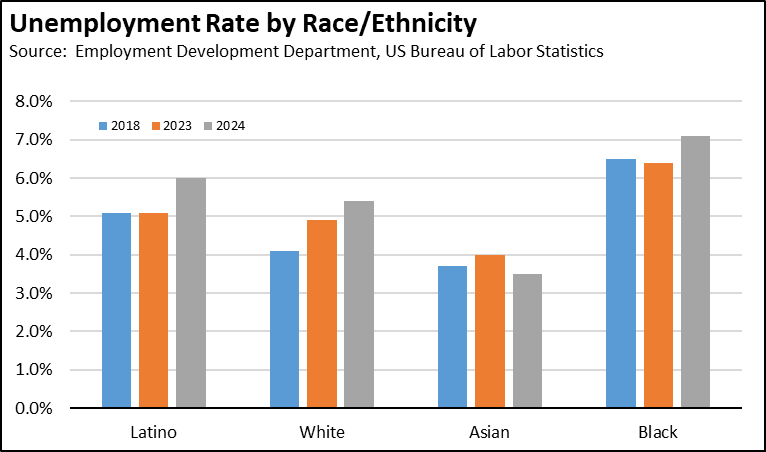
Unemployment Rate Demographics show the rates by Race and Ethnicity experienced different patterns. Comparing 2023 and 2024, Latinos saw their unemployment rate increase the fastest by 18%, while Asians dropped 13%. Between 2018 and 2024, White unemployment rates grew the fastest at 32%, while Asians declined by 5%. Blacks remained significantly higher throughout this period.
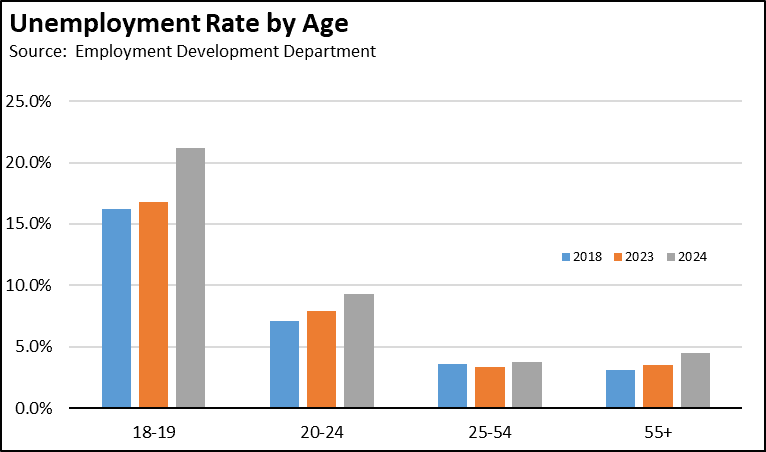
Unemployment Rates by Age show relatively little change among prime working age adults 24-54. Young Adults (20-24) and in particular Youth (16-19) show the highest increases as minimum wage increases have affected their job opportunities, with the Youth rate rising 31% since 2018.
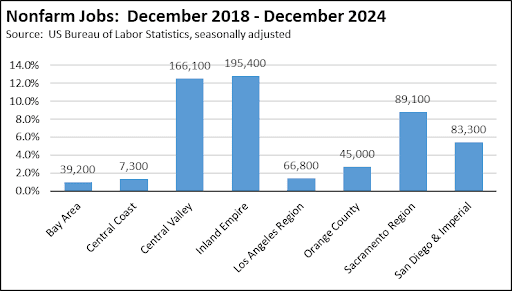
Employment by Region again shows growth in the less costly interior regions, while the coastal urban areas reflect their population loss to other regions and states during the pandemic. Compared to 2018, the budget-critical Bay Area shows the greatest losses in both relative and absolute terms.
Economy
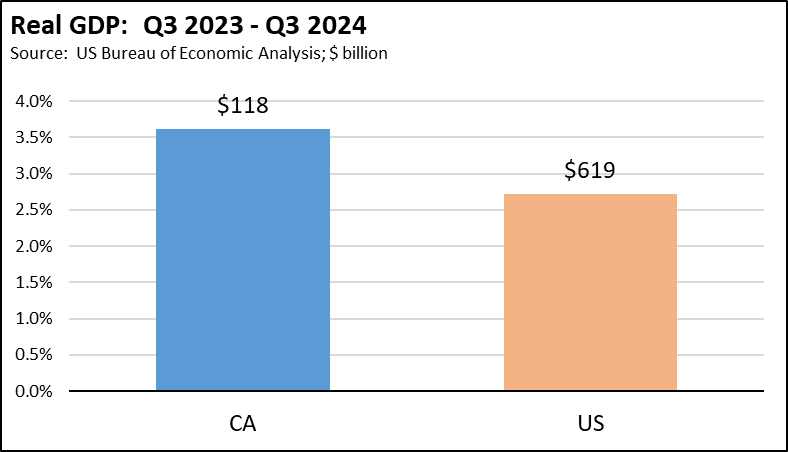
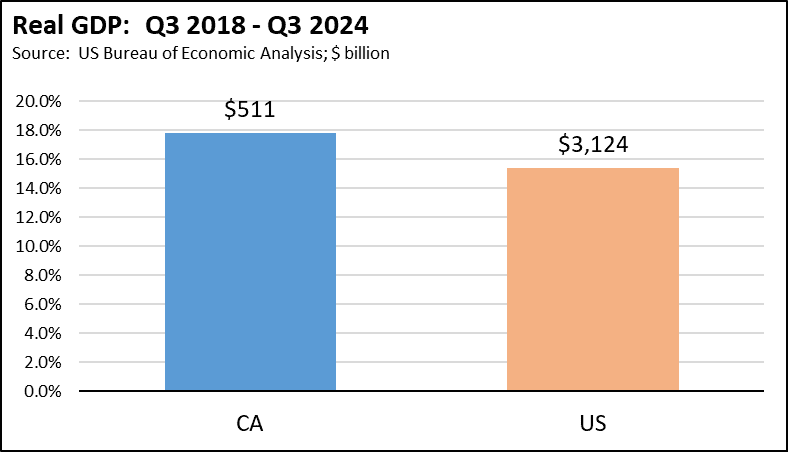
Real GDP grew somewhat faster to date in 2024, with California growing by 3.6% between Q3 2023 and Q3 2024 while the US was at 2.7%. The same results show in the period since Q3 2018, with California at 17.8% and the US at 15.4%. Overall, California showed little change in its relative size, going from 14.2% of US GDP in Q3 2018 to 14.4% in Q3 2023.
These outcomes are primarily due to the state’s High Tech sector. Tech produced an initial boost to the state’s pandemic recovery as these companies continued hiring and working remotely during the pandemic period. California GDP growth remained well above the US through Q4 2021, but then fell into recessionary conditions through Q4 2022 that brought California growth back to the overall US trendline. California again began to pull ahead of the US in Q1 2024 as AI brought a renewed boost to the GDP contributions from Tech.
For the year ended Q3 2024, the two sectors containing the primary High Tech industries produced 41.5% of the state’s Real GDP growth, while government and government-dependent Health Care & Social Services produced another 25.9%. Since Q3 2018, the two High Tech sectors were responsible for 61.4% of Real GDP growth, while government/Health Care did 16.2%.
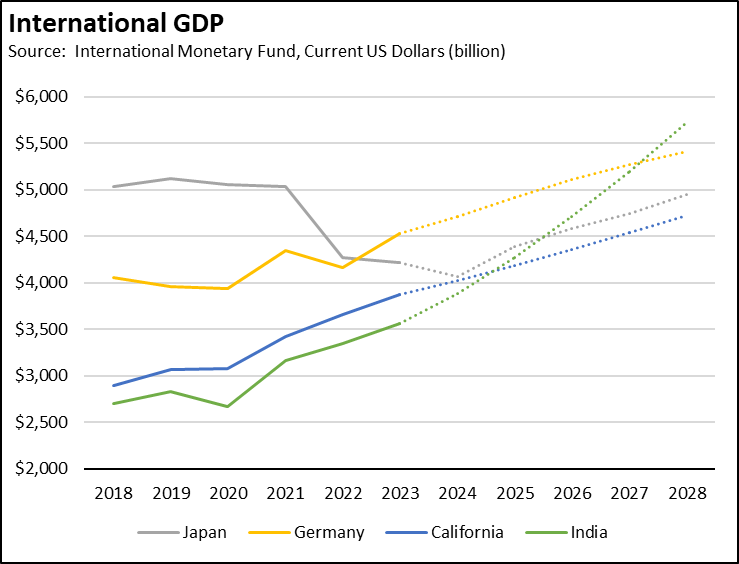
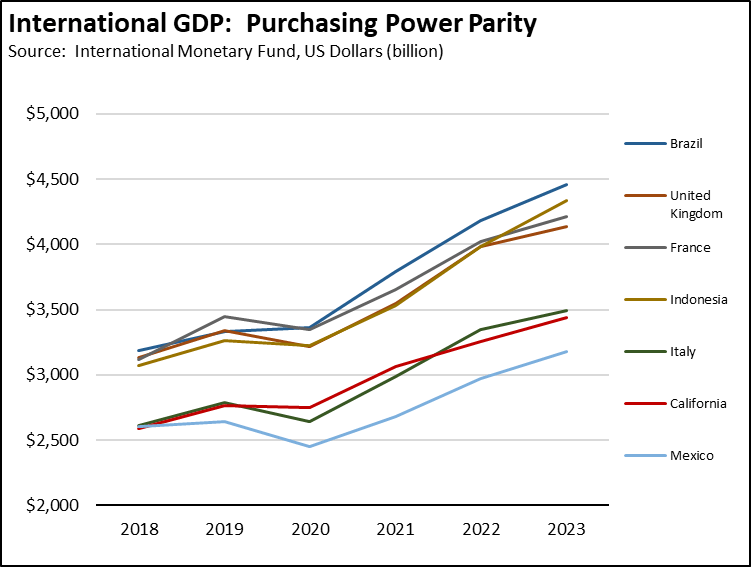
International GDP Rank saw California remain as the 5th largest economy in 2023. If California continues to grow at its present rate in 2024, the IMF projections show California dropping to 6th place by 2025 as India moves ahead.
California, however, dissipates the effective value of its GDP through high and growing costs. Using the US Bureau of Economic Analysis Regional Price Parity to adjust the California numbers to the IMF Purchasing Power Parity valuations of GDP, California moved ahead of Mexico in 2018, but fell to 12th largest behind Italy in 2022 and 2023.
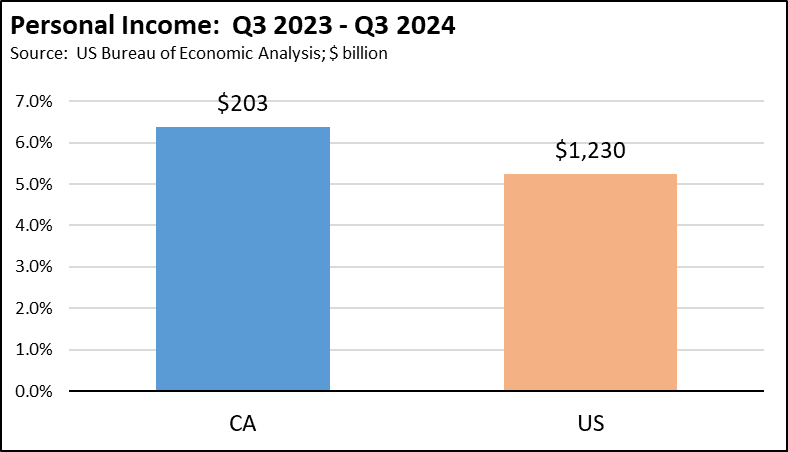
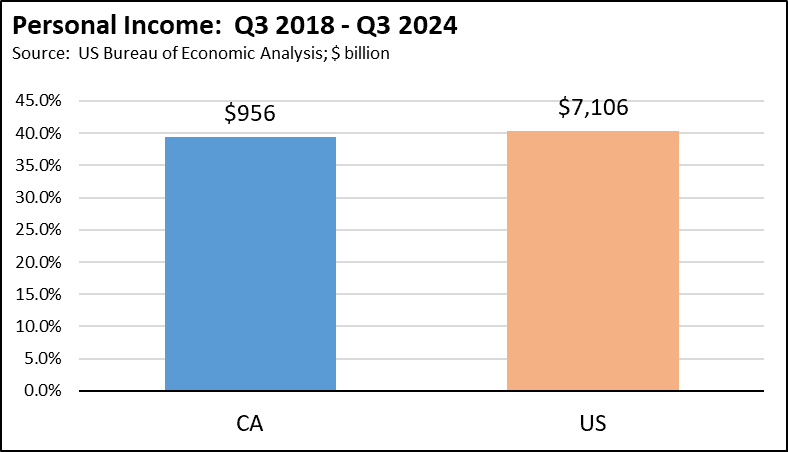
Personal Income rose somewhat faster, growing 6.4% between Q3 2023 and Q4 2024 in California and 5.2% in the US. Compared to Q3 2018, growth was little different at 39.3% for California and 40.3% for the US. California share of total Personal Income has remained essentially stable, going from 13.8% in Q3 2018 to 13.7% in Q3 2024.
The charts, however, show this indicator in nominal terms. Beginning in Q3 2018, inflation as measured by the US CPI offset these gains by 24.9%.
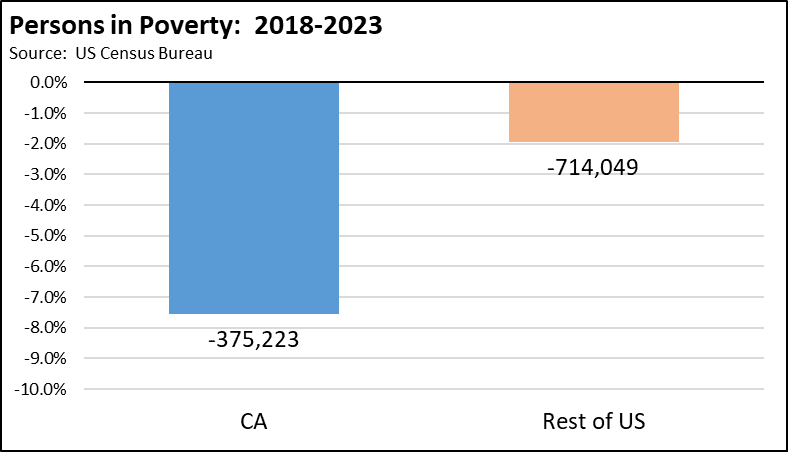
Persons Living in Poverty as defined by the official poverty measure dropped 7.5% in California between 2018 and 2023, and 1.9% in the rest of the US. Under this measure, California ranks as a middling state, going from 25th highest at 12.8% in 2018 to the 23rd highest at 12.0% in 2023.
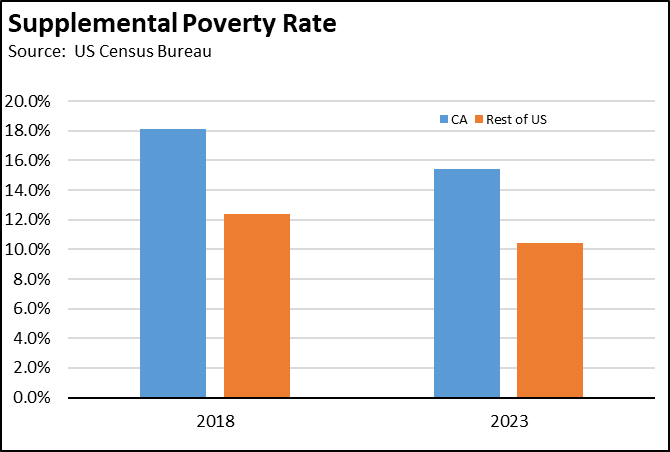
The Supplemental Poverty Measure, however, is a broader indicator of poverty taking into account income from government benefit programs, taxes, and costs of housing (including utilities and property taxes). By this measure, California had the highest poverty rate among the states at 18.1% in 2018 and the highest among the states and DC at 15.4% in 2023.
Measured by the official poverty rate, California had 11.3% of the nation’s population living in poverty in 2023, somewhat below its overall population share of 11.6%. Measured by the Supplemental Poverty Measure, California’s share was 16.4% due to the state’s high costs.
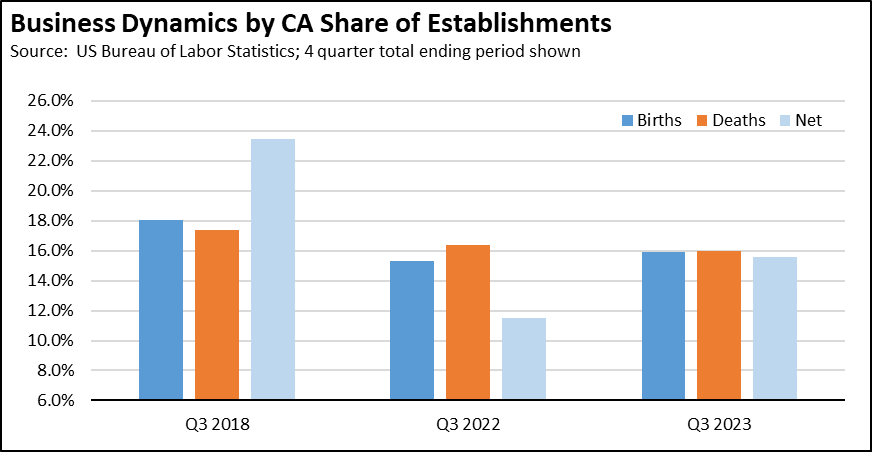
Births and Deaths of Businesses indicate California has a significantly higher turnover in its businesses relative to its overall population share of 11.6%. In the 4 quarters ending Q3 2023, California had 15.9% of new establishments in the US, up from 15.3% in the period ending Q3 2022 but down from 18.1% ending Q3 2018. The state also has a significantly higher share of closing establishments, with the share of establishment deaths essentially equal to births in the year ending Q3 2023.
Combining births and deaths, California’s share of net business creation was up from the year ending Q3 2022, but down substantially from the growth in the year ending Q3 2018 when California accounted for nearly a quarter of the nation’s net business creations.
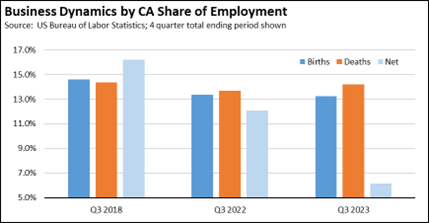
The second graph provides information on the same set of births and deaths, but by the number of employees involved. As indicated, while the state’s share of net new establishments was still relatively high, the associated employees were only 6.2% of the national total as the deaths covered larger business operations.
The definition of establishment births and deaths covers only ongoing operations and does not include temporary establishments such as seasonal stores. The data is not the same as for businesses (firms). A firm may be composed of one or more establishments such as a company operating several establishments (stores) in the state.
Costs of Living
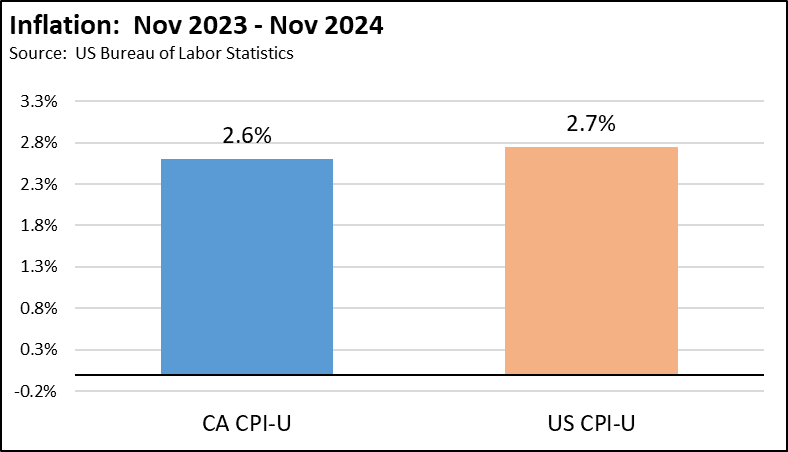
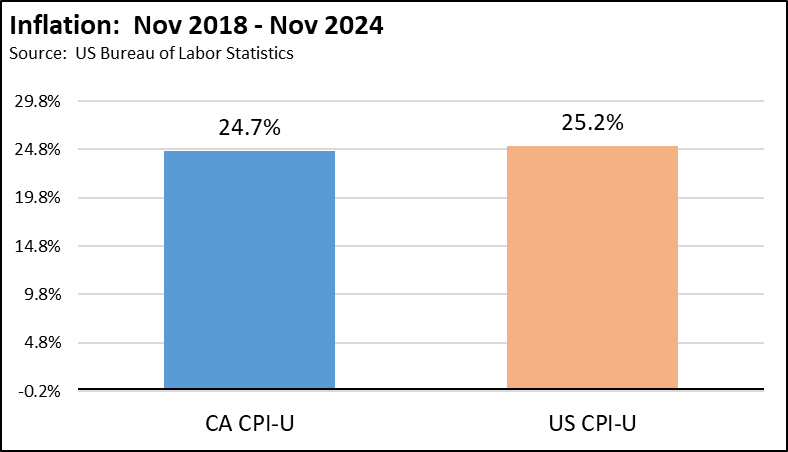
Inflation has been roughly equal whether measured in California by Department of Finance’s California CPI formula or by the US CPI. Since November 2023, inflation rose 2.6% in California. Since November 2018, inflation has eroded a quarter of the buying power of household incomes.
Looking at the individual CPI components, prices for Food Away from Home (restaurants and takeout) rose 6.1% in California between November 2023 and November 2024 as the result of California’s higher costs including the $20 minimum wage, while increasing 3.6% in the US numbers.
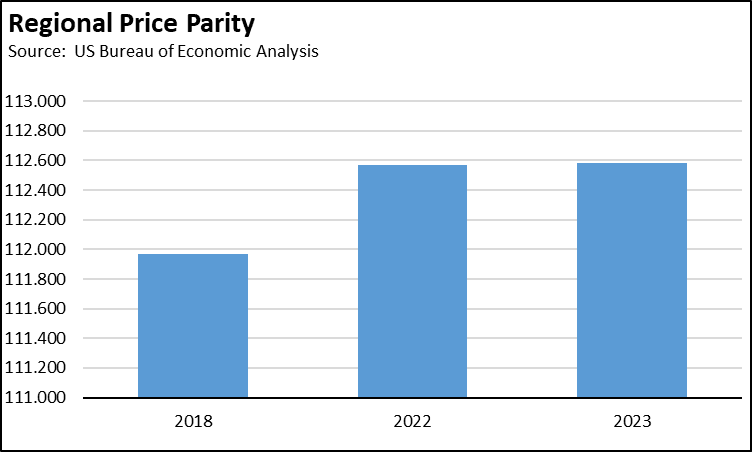
Regional Price Parities indicate that while the change in prices has been relatively the same as measured by the CPIs, California starts from a much higher price base. In 2023, California’s overall prices were 12.6% higher than the US average. In 2018 and 2023, California had the highest costs among the states and DC. In 2022, only DC was slightly higher.
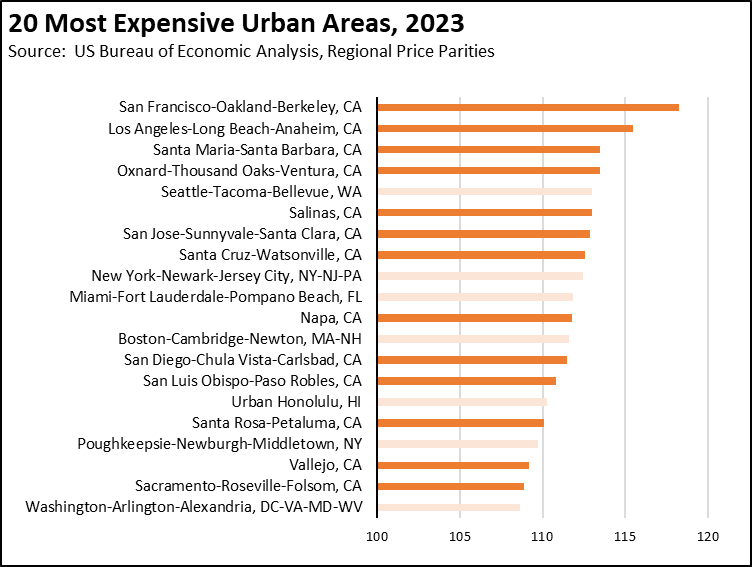
As measured by this metric in 2023, California had 7 of the 10 most expensive urban areas, and 13 of the 20 most expensive. This ranking was up marginally from 2018 when California had 12 of the 20 most expensive.
The Regional Price Parities measure prices relative to the US average, where US = 100 in each of the years.
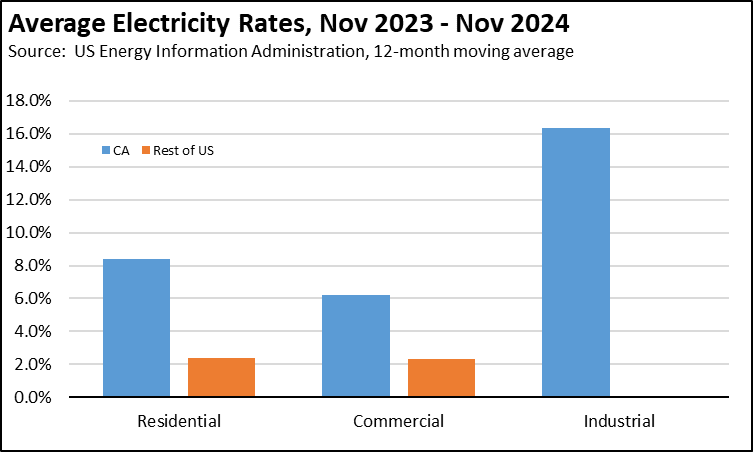
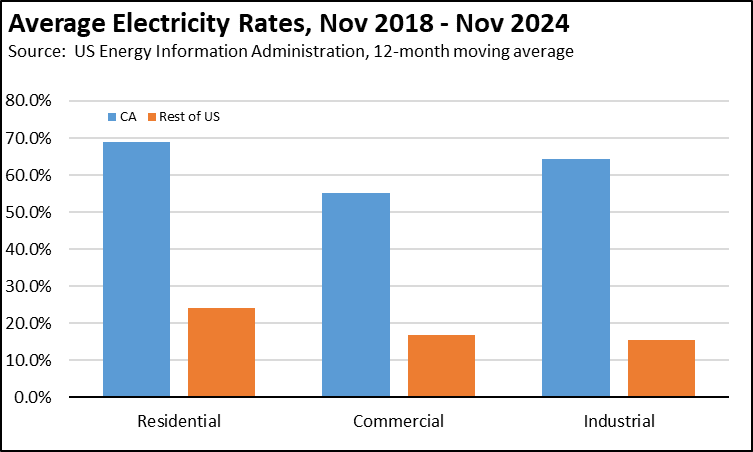
Electricity Rates (12-month moving average) have soared in California well above increases in the rest of the US. The average residential rate in November 2024 rose 8.4% over November 2023, and 68.9% over November 2018.
In November 2018, residential rates were 50.3% higher in California compared to the rest of the US, and by November 2024 they were 104.6% higher. The comparable numbers for Commercial rates were 60.3% in 2018 and 113.0% in 2024, and for Industrial rates, 99.8% in 2018 and 184.2% in 2024. These wide discrepancies in the Commercial and Industrial rates feed directly into California’s higher costs for goods and services, and undercut the state’s competitiveness especially for its declining manufacturing base and the associated blue collar middle class wage jobs.
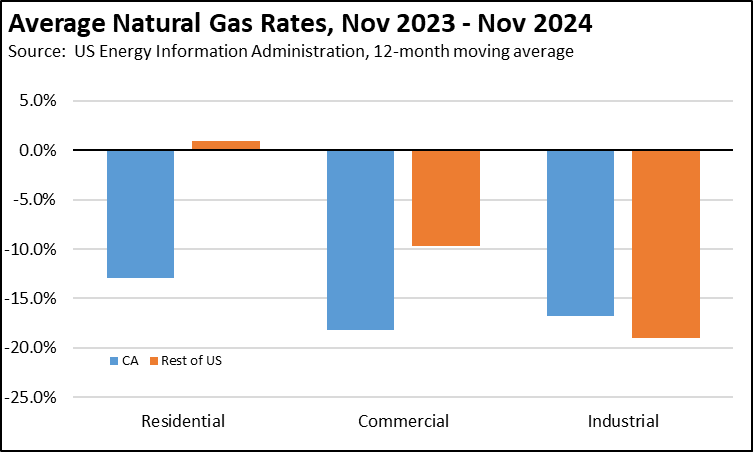
Natural Gas rates saw prices improve in California compared to November 2023 across all three end user groups, with prices showing less change for Residential and Commercial rates in the rest of the US but slightly better price improvement for Industrial rates.
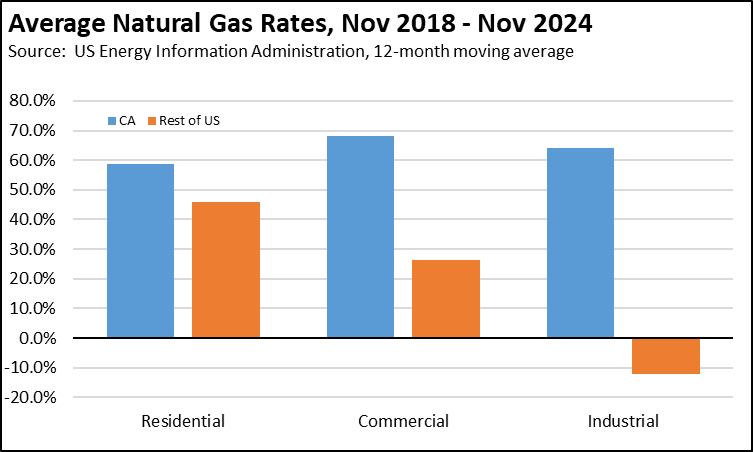
Compared to November 2018, prices rose faster in California, with the most pronounced differences in Commercial and Industrial rates. Residential rates in California were 18.1% higher than the rest of the US in November 2018 and grew to 28.7% higher in November 2024. Commercial rates were 9.2% higher in 2018, growing to 45.4% in 2024. Industrial rates affecting the competitiveness for manufacturing jobs saw the most dramatic change, going from 84.9% higher in 2018 to 245.8% higher in 2024.
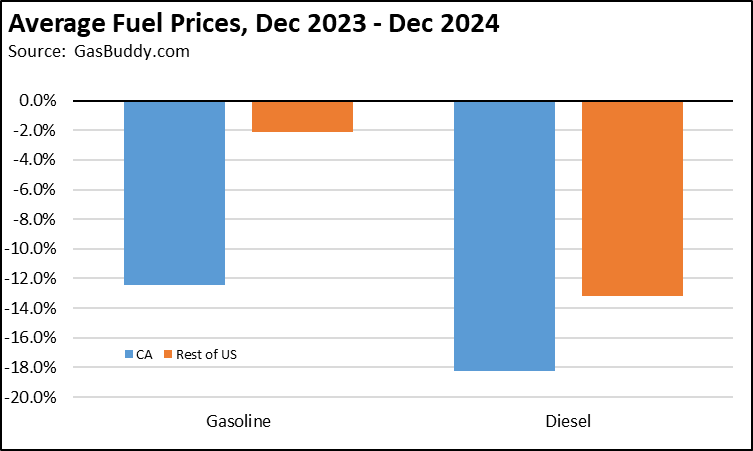
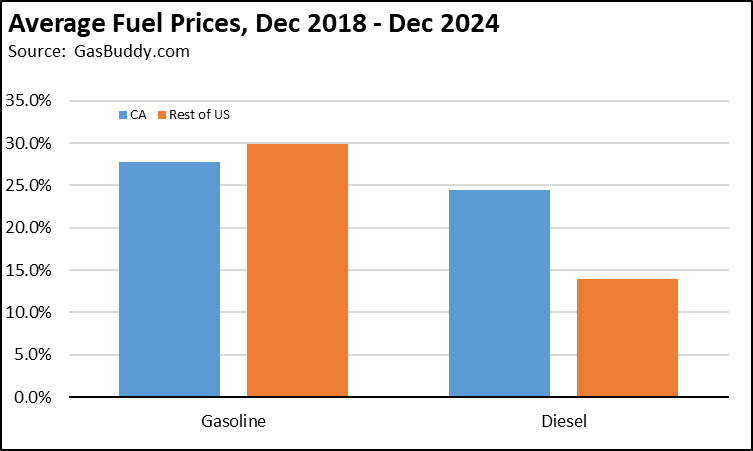
Fuel Prices showed greater easing in California between December 2023 and December 2024 as the state recovered from one of its periodic supply constrictions due to regulatory isolation from national and global supplies. Gasoline showed the most improvement relative to the rest of the US, falling 12.5%, while the 18.3% drop in diesel prices was closer but still better than the 13.2% drop in the rest of the nation.
Compared to December 2018, the price increase for gasoline in California was similar to the rest of the US, but diesel prices rose 24.5% in the state compared to 13.9% elsewhere.
But while there is less difference in the rates of increase for fuels, the cost gap with the rest of the nation remains substantial. Average gasoline prices in California in December 2024 were 48.2% higher than the rest of the nation, little changed from 50.6% higher in December 2018. Diesel, however, rose from 29.5% higher to 41.4% higher. Diesel as the predominant fuel used for goods movement feeds directly into household costs of living.
Taxes and fees continue to be a major driver of fuel costs in the state. Using Energy Commission data, taxes and fees made up 34.8% of the gasoline price increase between December 2018 and December 2024. These costs will continue to rise more substantially as the result of the Air Resources Board actions last year to increase the cost of Low Carbon Fuel Standard (LCFS) requirements and pending changes to Cap and Trade costs.
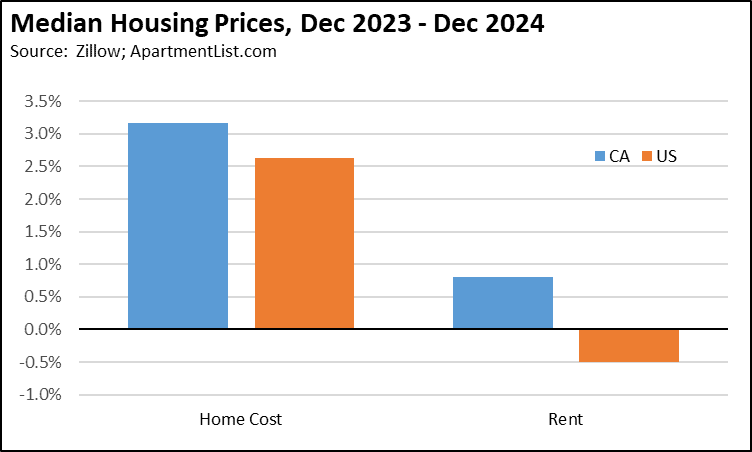
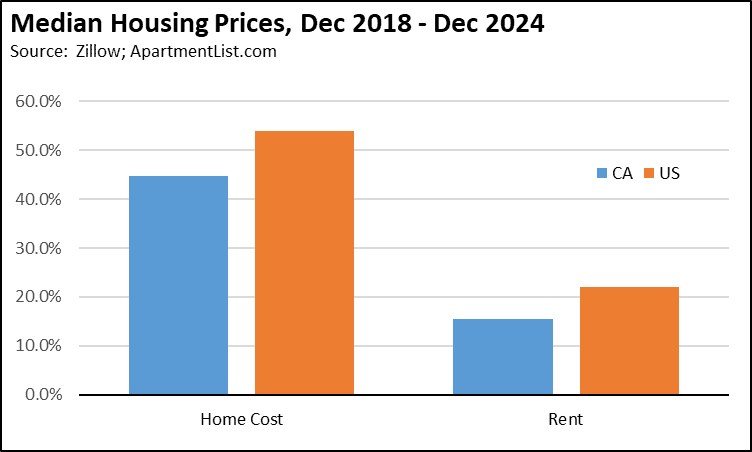
Housing Prices continue to climb but have also seen higher increases in the rest of the country as mortgage rates have affected housing construction. As measured by the Zillow index for All Homes, median prices rose 3.2% in California in 2024, compared to 2.6% for the US. Since 2018, costs have grown 44.8% compared to the US at 54.0%.
Median rents, all unit sizes, from ApartmentList.com show only minor growth in California in 2024 at 0.8%, and a 0.5% dip in the US. Since 2018, California has grown 15.5% and the US 22.0%.
As with many of the other indicators, these cost increases apply to a much higher price base in the state. Housing prices were 131% higher than the US median in 2018 and 117% higher in 2024. Median rent was 64% higher in 2018 and 55% higher in 2024.
Housing Costs cover more than just the price of the housing itself, either as rent or the purchase price. Monthly housing costs include mortgage payments (and therefore rising mortgage rates), rent, utilities (especially electricity and natural gas), property taxes, insurance, and other smaller items such as HOA dues. The utility portion is obviously driven by California’s rising energy prices. Proposition 13 provides a rare element of moderation on the property tax component.
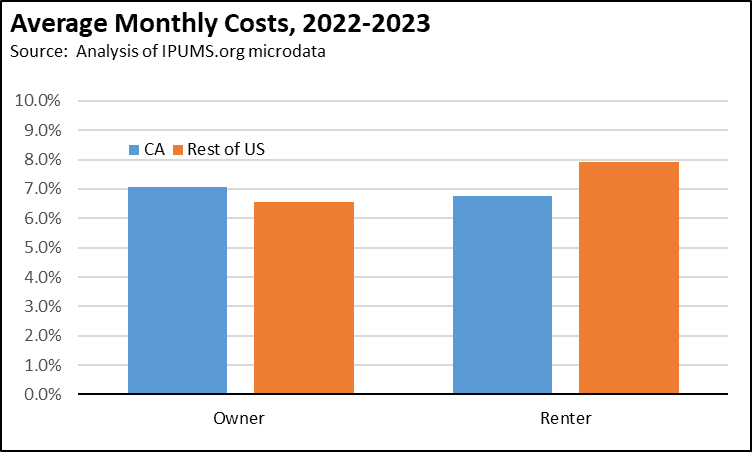
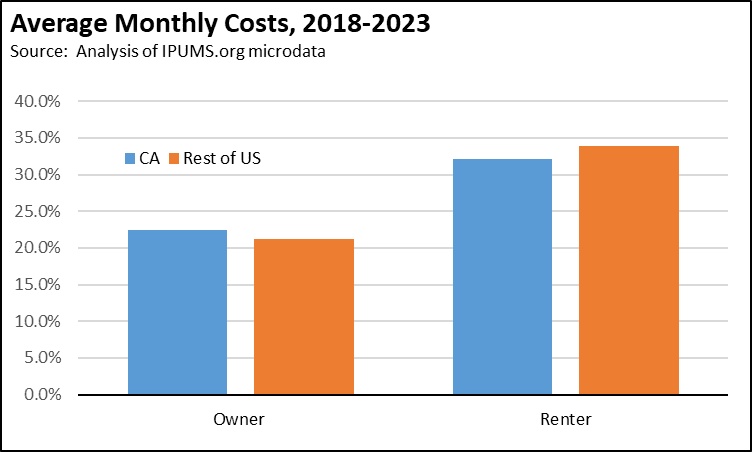
Average monthly housing costs in 2023 rose nearly the same for owners in California and the rest of the US, with California rising at 7.1% and 6.6% elsewhere. Renters saw about the same increase here (6.8%), but were somewhat higher (7.9%) in the rest of the US.
Costs between 2018 and 2023 followed a similar geographic pattern but with renters subject to much larger increases. Owner costs in California rose 22.5%, while renter costs were up 32.2%.
In 2018, the average monthly renter’s cost in California was 50% higher than for the rest of the US, and in 2023 was essentially the same at 48% higher. Homeowner’s monthly costs were 60% higher in 2018, and 62% higher in 2023.
The data in the charts is from nominal values and is not adjusted for inflation.
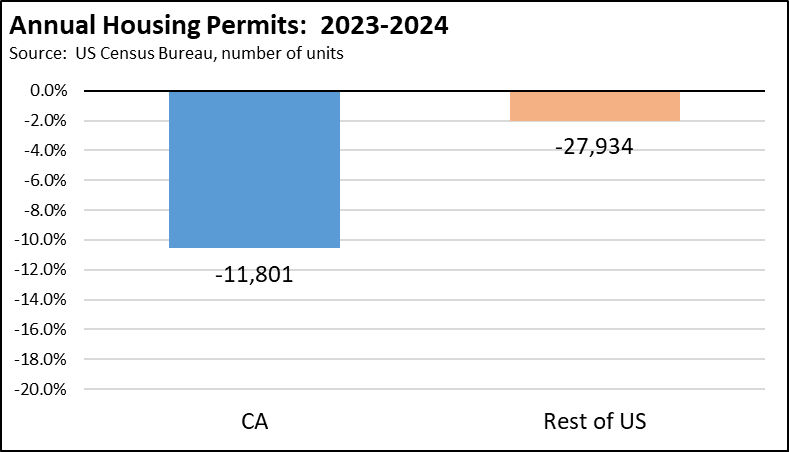
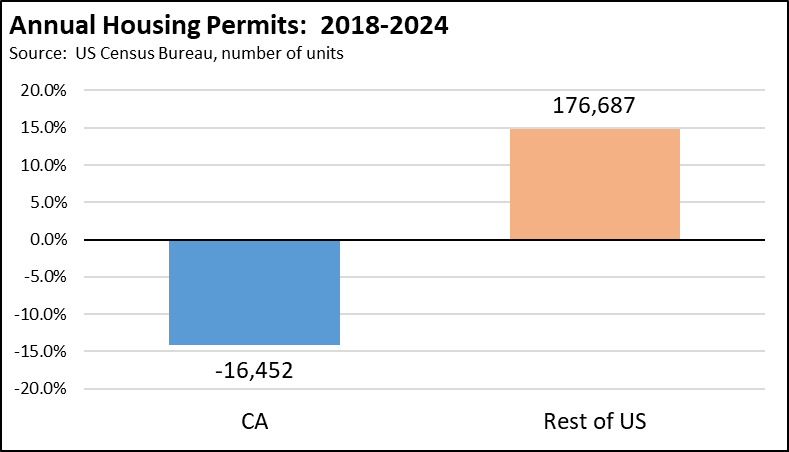
Housing Permits continue to lag in California. Total permits (units) dropped 10.6% in California in 2024, while easing only 2.0% in the rest of the US. Compared to 2018, annual permits were off 14.1% in California but rose 14.8% in the rest of the nation.
In 2018, California covered 8.9% of the total permits in the US. In 2024 after repeated legislative efforts to boost supply, the share was down to only 6.8%. Totaling all permits 2019-2024, California only contributed 7.3% of the new supply nationally through 656,800 units. In this same period, Florida permitted 1.1 million units, and Texas 1.4 million.
While several pieces of legislation have been enacted in an attempt to streamline permitting and boost supply, these bills typically include additional costs, restrictions, and reporting requirements that have offset any potential savings and severely limited their effectiveness. Rather than supply, the housing price moderation shown above instead has come more from reduced population pressure as the state and specifically the coastal urban areas have ceased to grow and reduced demand as mortgage rates continue to restrict new home sales.
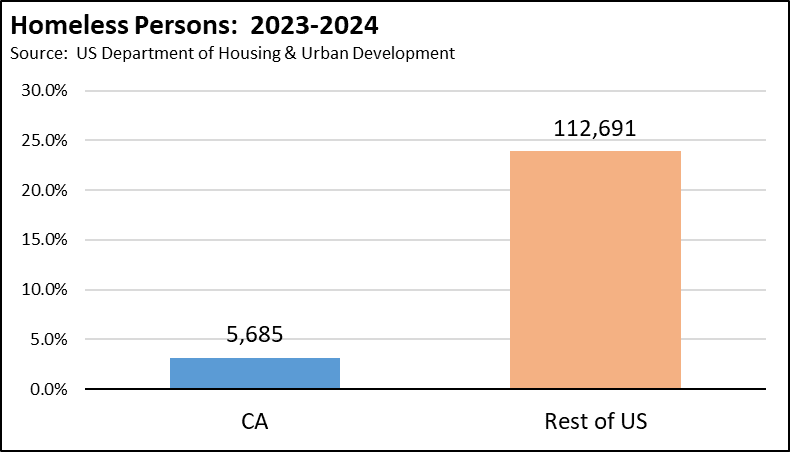
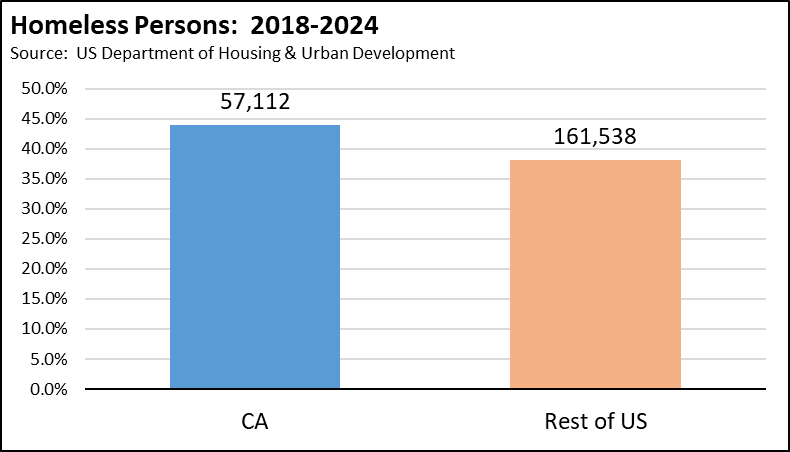
Homeless Population continues to increase but at a slower pace in California. The number of homeless was up 3.1% in 2024, compared to a much larger rise of 23.9% in the rest of the US. California’s low count, however, may be partially due to a number of counties changing how they did surveys this year.
Since 2018, the number of homeless in California grew by 43.9%, larger than the 38.2% in the rest of country.
In 2018, California had 23.5% of the country’s homeless population, double its overall population share. In 2024, the share ticked up to 24.3%.
Public Finance
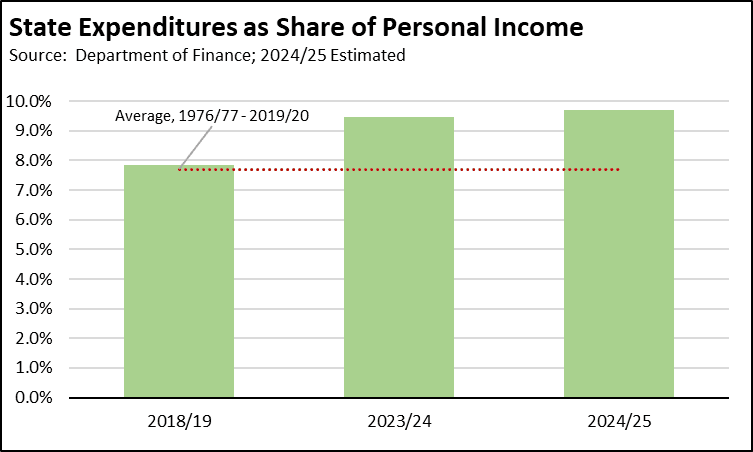
State Spending expansion has been one of the primary factors replacing private job creation in the state with government and government-dependent jobs. Total state fund expenditures (general and special funds) as a share of state Personal Income at 7.9% in 2018/19 were near the long-term, highly stable average of 7.7%. In 2023/24, this spending grew to 9.5%. Based on the January Proposed Budget, spending is expected at an all-time high of 9.7% in 2024/25.
Overall, state spending for 2024/25 is estimated in the January Budget to increase by 65.9% in nominal terms since 2018/19.
The ability of the state to maintain these high levels of spending, however, is uncertain. As spending has soared past revenues, the January Proposed Budget indicates that just within the general fund, the state expects current year operating deficits ranging from $11 billion to over $19 billion every year between 2024/25 and 2028/29. Current reserves are sufficient only to cover the first two years including use of the Rainy Day Reserve to maintain current spending overages rather than its intended use for economic emergencies. The LAO projections expect annual deficits to be much higher in the outer years, in the $25 to $30 billion range.
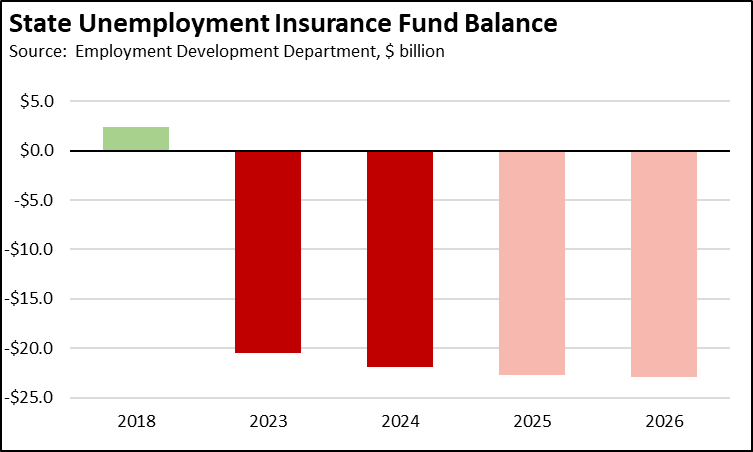
These numbers, however, do not include other debts the state has chosen to ignore. The state UI fund debt increased to $21.9 billion at the end of 2024, while every other state except New York used the federal funds provided for this purpose to pay off their pandemic-era debt. In fact, EDD’s latest projections expect California’s debt to continue growing to $22.9 billion by the end of 2026 due to rising unemployment, even though taxes on employers are now undergoing automatic increases.
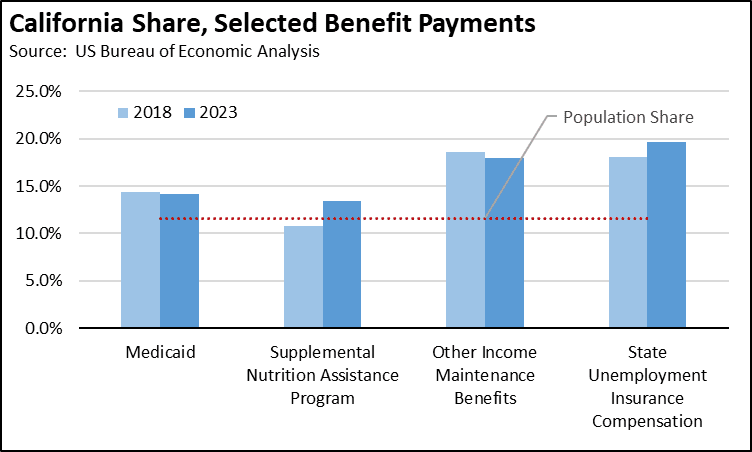
California’s Share of Benefit Program Payments illustrates the state’s current shift away from promoting jobs creation to a focus more on income redistribution. Combined with persistently high unemployment levels, California has had an increasing share of workers and families dependent on benefit payments. In 2023, California’s share ranged from 13.4% of all Supplemental Nutrition Assistance Program (SNAP) payments to 19.6% of all State Unemployment Insurance Compensation payments, all higher than the state’s overall population share of 11.6%. The program shares showed little change from 2018, except SNAP which grew 25% and Unemployment Insurance which grew 9%.