The Center for Jobs and the Economy has released our full analysis of the February Employment Report from the California Employment Development Department. With California now posting the highest unemployment rate in the nation, this report focuses specifically on unemployment data to provide crucial insights into the state of employment in California. For additional information and data about the California economy visit www.centerforjobs.org/ca
Highlights for policy makers:
- Key Takeaways
- California Posts Highest Unemployment Rate in the Nation
- Unemployment by Demographics
- Employment Dynamics & Unemployment
- Effects of Job Growth Structure on Unemployment
Key Takeaways
- California’s Unemployment Rate: California’s unemployment rate reached 5.3% in February, the highest in the nation and the highest in California since December 2021. Total number of unemployed surpassed projections made for the budget by Department of Finance by 7%, adding further strain to a state budget already facing multi-year deficits due to high spending.
- Unemployment Trends: Since August 2022, California’s unemployment rate has risen steadily while post-pandemic job growth remains behind Florida, North Carolina, and Texas. Since August 2022, California number of unemployed has grown by 304,200, or just under two-thirds of the 475,000 total increase experienced by the nation as a whole in that period.
- Demographic Impact on Unemployment: Workers with lower education levels, younger individuals, Latinos, African-Americans, and men are disproportionately affected by unemployment, highlighting the need to reconsider policies holding back job creation for these demographics.
- Employment Dynamics & Unemployment: California’s job openings rate has declined steadily, impacting the potential for future jobs expansion as employers, especially in the tech industry, pull back on expansion plans. Unlike the US overall and the better-performing states, the demand for workers has fallen below the supply since last fall, resulting in the rising number of unemployed.
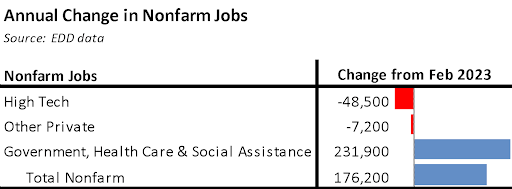
- Effects of Job Growth Structure on Unemployment: Job losses in California’s high-tech sector continue to grow, while all net new jobs created over the past year came only from industries fully or partially dependent on public funding: government, health care, and social assistance. As the windfall tax revenues from high tech supporting those jobs recede, future job trends will become determined more by the cost and regulatory restrictions affecting the rest of the traditional industries in the state’s economy.
California Posts Highest Unemployment Rate in the Nation
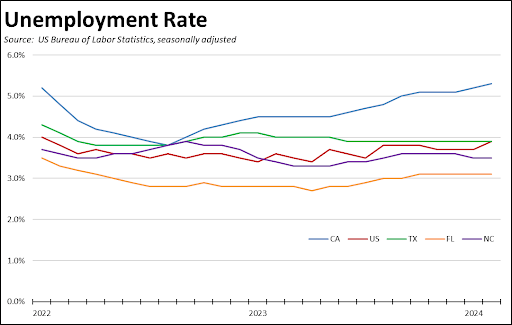
As discussed in our preliminary report, California’s unemployment rate rose to 5.3% in February, the highest rate among the states and DC and the highest in California since December 2021. In contrast, the Department of Finance economic projections expected the state unemployment rate to average 4.9% in the first quarter of 2024 before gradually rising to 5.2% in Q4 2024 through Q3 2025 and slowly declining in the quarters after. The total number of unemployed in February is 7% higher than those projections, adding yet additional strains to a state budget already mired in sizeable deficits due to projected spending over the next five years. The Finance projections, however, got the US unemployment rate right at 3.7%.
After reaching a post-pandemic low of 3.8% in August 2022, California unemployment since has risen steadily, increasing 39% compared to the overall US rate which has varied only 8%. California’s rate also has increasingly diverged from Florida, North Carolina, and Texas, the three states that in absolute numbers have shown higher post-pandemic job growth. Rates have remained lower in those states because their economies are creating more jobs.
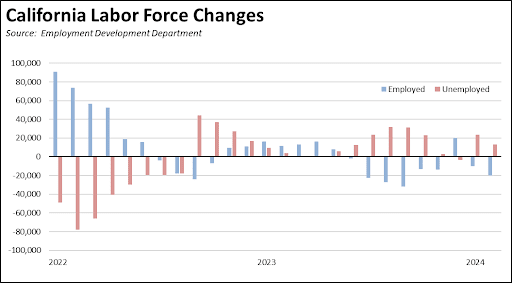
In the first part of 2022, the California labor force numbers had been showing recovery, with employment rising and unemployment dropping but at increasingly slower rates. Those trends reversed beginning that August, with employment subsequently posting losses or at best marginal gains, and unemployment showing an almost unbroken string of expansion. Since August 2022 through last week’s report for February, California employment dropped a total of 65,000 and still moves further away from recovery to the pre-pandemic levels. The number of unemployed has grown by 304,200, or just under two-thirds of the 475,000 total increase experienced by the nation as a whole in that period.
Unemployment by Demographics
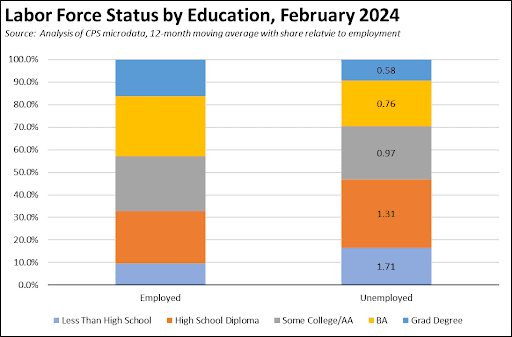
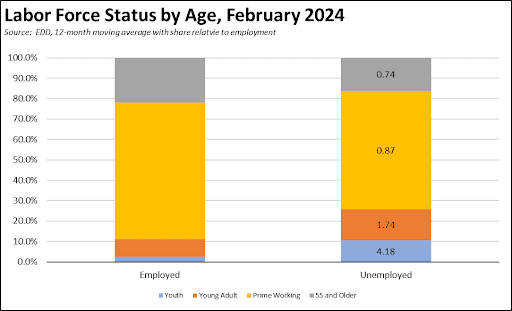
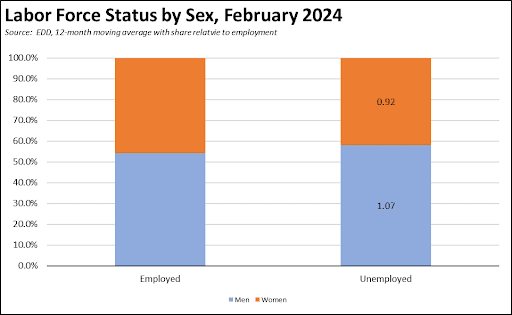
Demographic information is obtained from a separate data source, Current Population Survey (CPS), that is at the base of but differs from the numbers contained in the monthly labor force reports. Due to the relatively smaller size of the survey, state-level results have more statistical significance when reported as a 12-month moving average rather than a single month estimate. This source consequently is more useful in showing a distribution rather than point estimates. In the charts below, the relative incidence of unemployment by each demographic characteristic is shown as the ratio of unemployment share to employment share. For example, a ratio of 1.31 means the share of unemployed is 31% higher than the relative share of employment. A ratio of 0.58 means it is 42% less (1 – 0.58).
Summarizing the results below, California’s relatively weaker job creation has seen unemployment in particular affecting workers with a high school diploma or less, younger workers, Latinos and African-Americans, and men. State and local policies that continue to make it more costly for employers to create jobs targeted to these populations and their skill and experience levels will only intensify rather than reverse the current unemployment trend. High tech—the one industry to which the state has taken a “regulatory hands-off” approach due to its critical role to state revenues—never was able to meet the employment needs of these sizeable portions of the labor force even before the current downsizing. And with the tech industry now restructuring, the state has fewer options to offer to its workforce, as discussed in the last section, due to its current and pending regulations that have substantially raised the cost of employing workers in the other more traditional industries.
By highest level of education completed (age 16 and over), unemployment currently affects lower skilled workers to a far greater extent. In February, just under a third of all the employed had a high school diploma or less, but these educational levels combined accounted for 46.9% of total unemployed. At the other end of the scale, workers with a BA or higher made up 43.0% of total employed, but only 29.5% of the unemployed. While high tech continues to announce layoffs of these credentialed workers, this trend has yet to affect the unemployment numbers to the same degree that the state’s various policies affect job availability for the state’s lower-skilled workers.
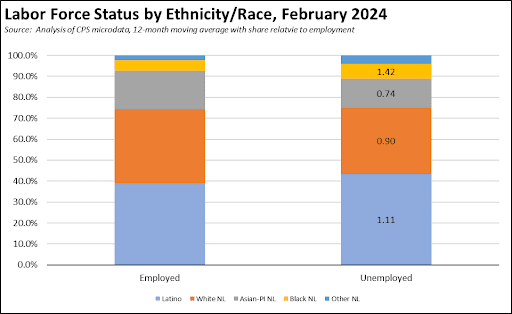
By ethnicity and race, non-Latino Blacks are 42% more likely to be unemployed and Latinos 11% more, compared to non-Latino Whites at 10% less likely and non-Latino Asian-Pacific Islanders at 26% less.
By age, unemployment is having a higher effect on younger workers, with both Youth (16-19) and Young Adults (20-24) both having a much higher relative incidence. Older workers in contrast are likely still choosing retirement rather than unemployment when losing a job, similar to the conditions that prevailed during the pandemic job closures.
There are narrower differences by sex, but men were 7% more likely to be unemployed relative to their employment share.
Employment Dynamics & Unemployment
The US Bureau of Labor Statistics’ Job Openings & Labor Turnover Survey (JOLTS) provides monthly estimates of the jobs dynamics in each of the states rather than the static, point-in-time estimate given by the monthly employment reports.
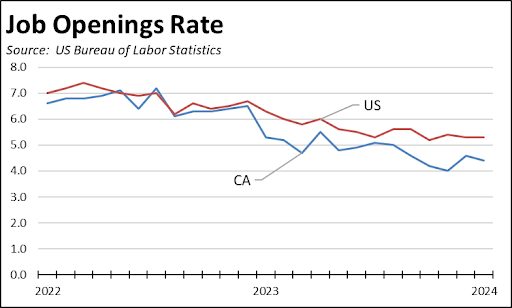
The job openings rate provides a comparative measure of job growth potential, calculated as the number of unfilled job openings at the end of a month as a percent of the sum of employment and job openings. This metric can be used to indicate the unmet job expansion potential within a state or the US. As indicated in the chart, the rates have declined in general in both California and the US as a whole. The US rate, however, essentially leveled off in recent months while California’s has continued on a general downward trend. Employers nationally continue to anticipate additional growth. Employers in California, as represented by the tech industry, have been pulling back on their expansion plans.
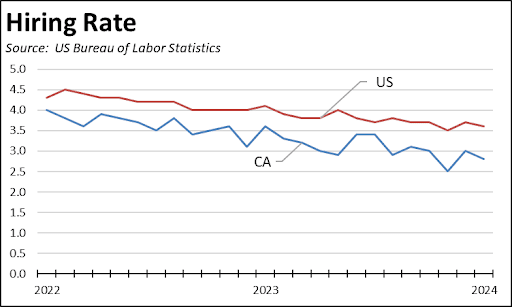
The hiring rate shows the monthly addition of jobs, calculated as the number of new hires each month as a percent of total employment. As indicated in the chart below, gross jobs expansion in California has remained below the overall US average and is slowing.
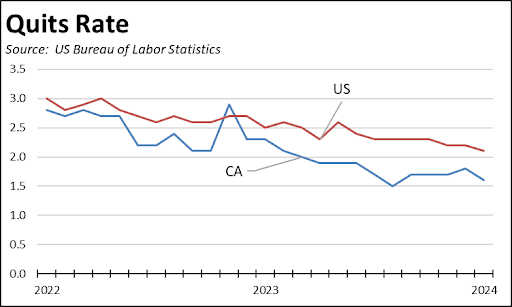
The quits rate measures a portion of the other side of the jobs dynamics, the number of workers quitting each month as a percent of total employment. The rate of workers quitting has dropped at both the national and state levels as concerns over the direction of the economy have become more pronounced. The slowing again is more notable in California.
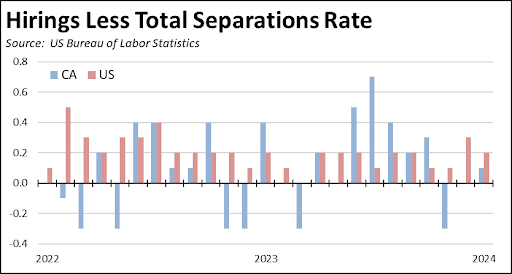
The full dynamics then can be seen by comparing the gross addition of jobs through hiring and the gross reductions through total separations, composed of both quits and layoffs and discharges. As indicated in the chart, net job additions have been positive for each month since 2022 at the national level. California’s performance has been far more variable, with the two rates canceling each other out or producing a contraction in 11 of the 25 months shown in the chart.
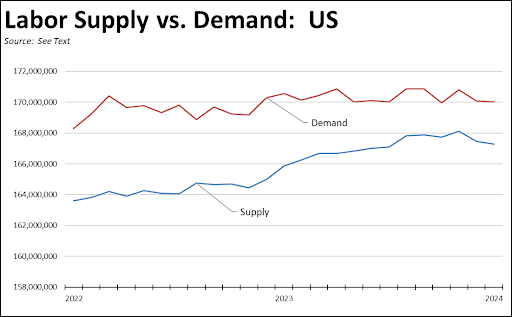
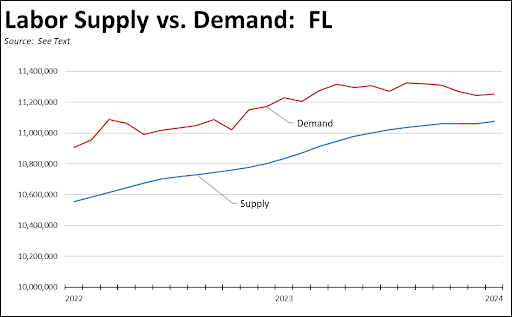
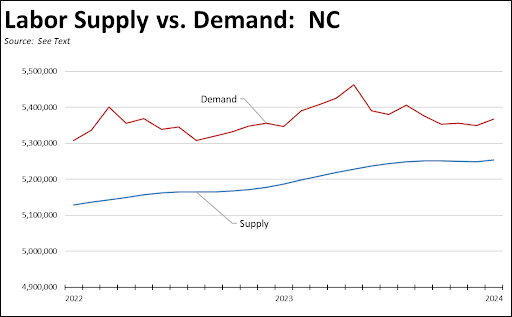
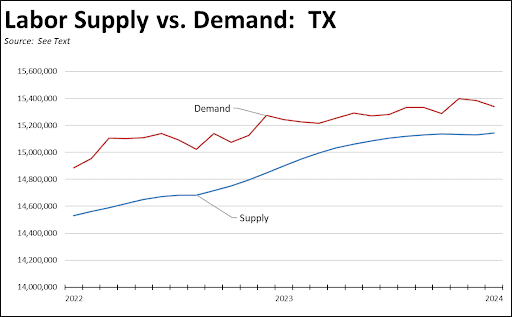
As we have done in previous reports, the JOLTS data can also be used to illustrate overall labor supply and demand conditions in the state. In the charts below, labor supply consists of persons either working or looking for work, calculated as the sum of the number of employed and unemployed. Labor demand consists of the total number of jobs currently filled or open for hiring, calculated as the sum of the number of employed and number of unfilled jobs from JOLTS. As indicated, the overall conditions at the national level still indicate a degree of labor shortages, with employers having more jobs to fill than workers with the necessary skills to fill them.
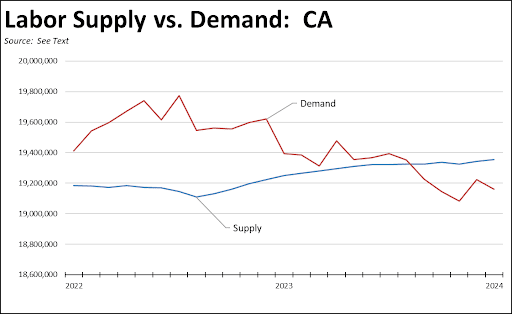
California, on the other hand, now faces the opposite conditions. Since last fall, the total number of jobs—both filled and open—has fallen below the number of workers in the labor force. This situation has contributed to rising unemployment in two ways. First, the California economy is now producing fewer jobs than the number of workers looking for work. Second, there continues to be disconnect in many instances between the skills needed for the available jobs and what the current labor force can provide. As indicated earlier, nearly half of the current unemployed have an education level of a high school diploma or less. This education level is sufficient to secure jobs in some of the state’s better paying growth areas, notably trade and transportation. These industries, however, are under increasing regulatory and cost pressure from both state and local policies, and others such as food services are currently restructuring in advance of the state increase in the minimum wage. Longer term, the state’s public schools continue to post educational outcomes that fail to prepare students, especially Latino and African-American students, with the basic proficiency required by employers.
The three states showing better job performance than California in the post-pandemic period are in fact positioned to do even better. In all three cases, labor demand continues to outstrip the available supply.
Effects of Job Growth Structure on Unemployment
Using the Current Employment Statistics data for comparable categories where available under the Center’s definition of the industry, job losses in California High Tech widened to 48.500 over the year, with only just over a quarter of the losses coming in the manufacturing components. The other Private industries contributed an additional 7,200 jobs to the overall losses. All of the state’s job growth in this period instead came from the industries largely dependent on public funding ranging from 100% in the case of government, to mostly all in the case of Social Assistance and its composition coming largely from In-Home Supportive Services (IHSS) workers, and a mix including the Medi-Cal and Obamacare driven growth in the case of Health Care.
To put these losses into a state budget perspective:
- The 48,500 Tech jobs translate into a loss of $9.7 billion in taxable personal income, using the most recent wage results for the first three quarters of 2023. Using the NBER Taxsim program (v.35), this income loss results in a state tax revenue loss of $858 million from personal income and SDI taxes, plus additional amounts related to sales tax and other state taxes and fees. To simplify the calculations, the Taxsim runs were done assuming single filer status and no other income or deductions.
- The 231,900 Government, Health Care & Social Assistance jobs translate into a gain of $14.6 billion in taxable personal income, but yielding only $737 million from personal income and SDI taxes plus the related additional amounts.
- These taxes, however, are offset by the state costs related to those 231,900 jobs. The state pays both wages and benefits for the state and IHSS jobs, with 37% of the IHSS costs coming from the state general fund. The state also provides on average 43% of local school costs, plus 17% of city and county costs. Using the most recent 2020 results, Medi-Cal (state and federal dollars) paid 21% of total health care costs in the state of which 24% comes from the state general fund. Applying these ratios, the offsetting costs to the state for wages and benefits—and not including associated operating costs—related to the 231,900 jobs comes to an estimated $4.2 billion.
- Incorporating all these elements, the net cost to the state budget generated by the pattern of jobs growth over the past year is $4.4 billion. These numbers do not include any other state taxes and fees other than the two indicated, and also do not incorporate any additional losses related to the other Private jobs due to the relatively small number involved.
California for years has been able to ignore the economic effects coming from the high costs of living and doing business in the state being driven by its ever-growing body of regulations and policies. The high level of incomes and associated tax revenues flowing from the High Tech industry papered over the economic dislocations coming from a development trajectory that saw jobs being created primarily at the high wage end in tech and in the lower wage industries providing services to the population. The middle instead was dominated by government-paid growth. With High Tech now retrenching, the fiscal model underlying this growth structure is now fraying.