The Center for Jobs and the Economy has released our full analysis of the July Employment Report from the California Employment Development Department. For additional information and data about the California economy visit www.centerforjobs.org/ca.
Highlights for policy makers:
Recovery Progress
As discussed in our preliminary report, the July again reported slowing in the state’s economy. The nonfarm job numbers broke the previous pattern since April 2022 of the first quarter reporting job gains above 60,000, followed by slower gains in the following two months. Comparing just the first month of each quarter in this period, the July number was 59% lower. The employment numbers reported a loss of 17,000, reversing much of the gain the prior two months and keeping total employment essentially unchanged since June 2022.
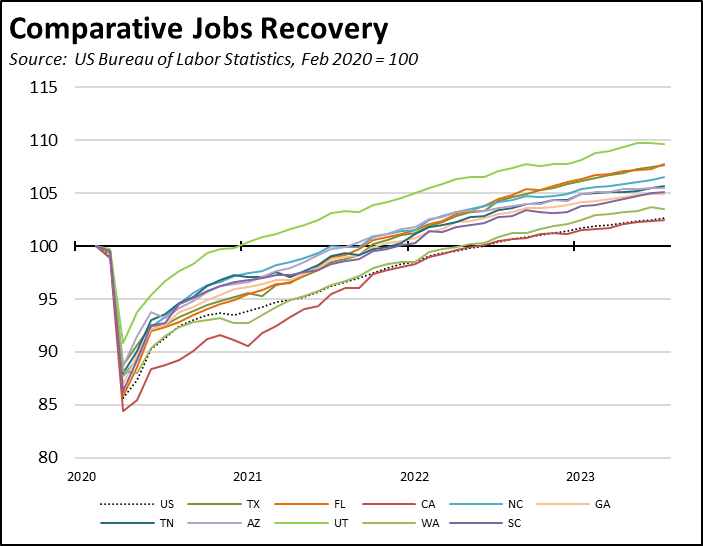
Comparing net jobs creation since the pre-pandemic high, California again came in third at 443,500, behind Texas at 997,800 and Florida at 704,00. Using the relative growth rate to compare states, California remained in 21st place and essentially matched the national average. The chart below compares the net jobs rate for the 10 states with the largest jobs growth in absolute numbers. The faster growth particularly in the Southeastern states illustrates the shifting economic center for the nation, combining pandemic era actions that promoted quicker recovery along with policies since then that have facilitated faster jobs growth.
Unemployment Claims Approach 2022 Levels
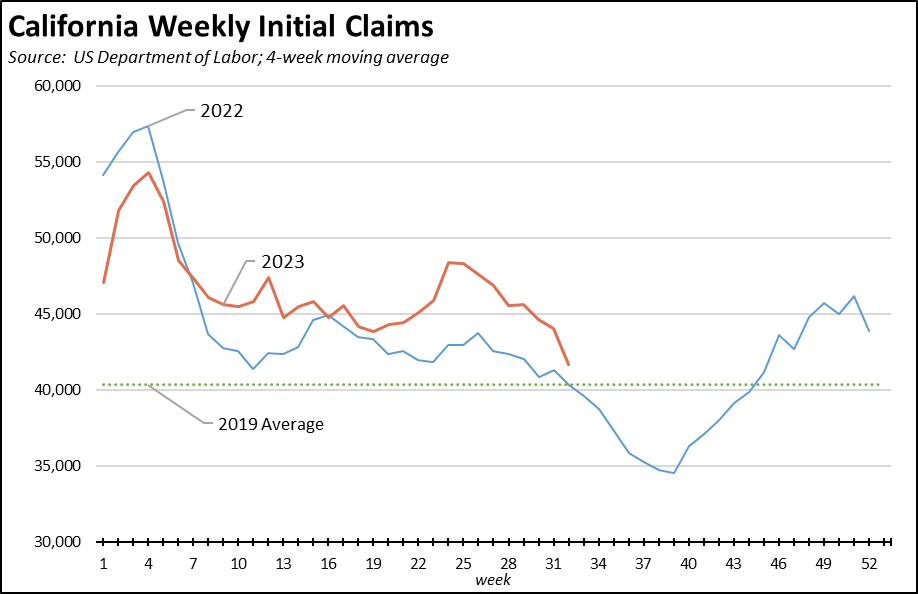
After an elevated upsurge, initial unemployment insurance claims (4-week moving average) dropped near levels seen during the same period in 2022. Initial claims, however, were still somewhat above the average in pre-pandemic 2019.
In contrast, insured unemployment—a proxy for continuing claims—remained well above both the 2022 and 2019 trends, continuing a drag on overall employment and jobs expansion potential.
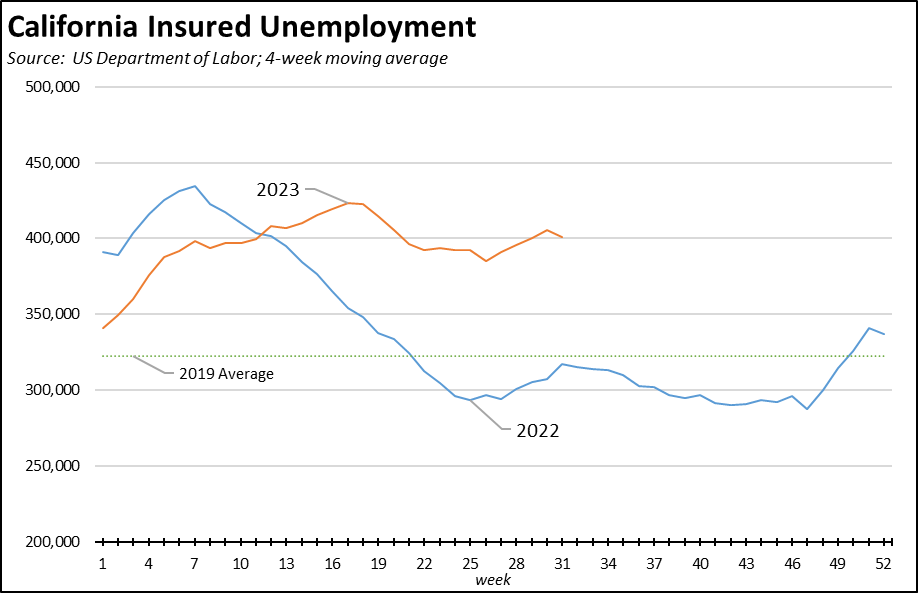
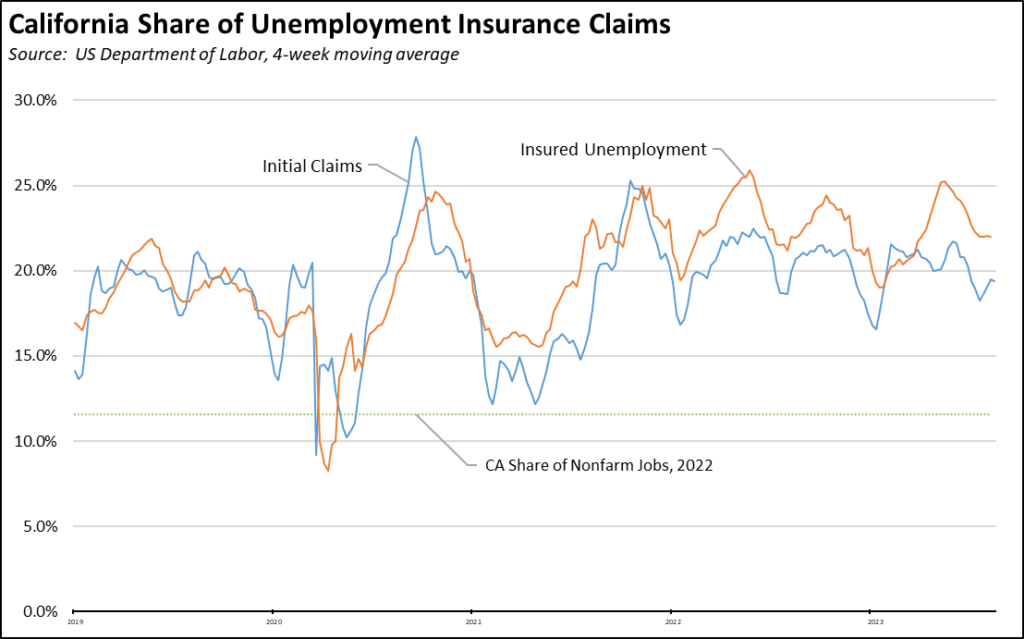
But while initial claims have eased in the latest results, the program overall as it is administered in California covers a much larger share of the labor force than nationally. In the latest results (4-week moving averages), California produced 19.4% of all initial claims and 22.0% of insured unemployment. In contrast, California contained only 11.6% of all nonfarm jobs.
The program as it functions in California already is stressing the fiscal solvency of this critical benefit as the result of past expansions of benefits without proper consideration to how they were to be funded, a trend that mushroomed during the pandemic when the state relied on this program to offset the impact on workers from the job closures. California’s unemployment insurance fund debt was $18.0 billion in the latest report for August 14. By failing to address this debt, the state budget ensures that employers will continue paying the state UI tax at its highest rate schedule. Employers also will be subject to an increase in the federal UI tax, growing at an additional 0.3% to 2.7% annually until the federal debt is paid off.
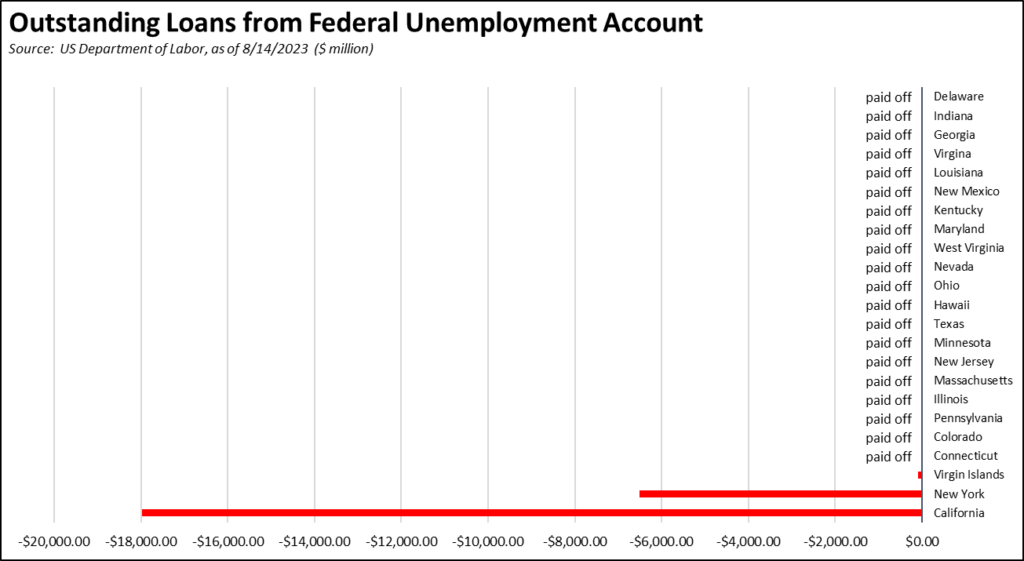
EDD’s most recent fund forecast projects further deterioration in the fund’s conditions, reaching an expected $20.3 billion deficit by the end of 2024. This fiscal weakening is expected even under a forecast that does not include a new economic downturn in this period. Yet, even as the fund is expected to go further into debt under normal circumstances, yet additional benefits expansion is now being considered which would push the fund closer to insolvency.
CaliFormer Businesses
Additional CaliFormer companies identified since our last monthly report are shown below. The listed companies include those that have announced: (1) moving their headquarters or full operations out of state, (2) moving business units out of state (generally back office operations where the employees do not have to be in a more costly California location to do their jobs), (3) California companies that expanded out of state rather than locate those facilities here, and (4) companies turning to permanent telework options, leaving it to their employees to decide where to work and live. The list is not exhaustive but is drawn from a monthly search of sources in key cities.
Focusing on trends in individual industries, a recent Bloomberg analysis of SEC filings since the end of 2019 indicates that both California and New York saw an exodus of investment firms managing nearly $1 trillion in assets in both states. Investment firms leaving California primarily moved to Texas, while those leaving New York favored Florida.
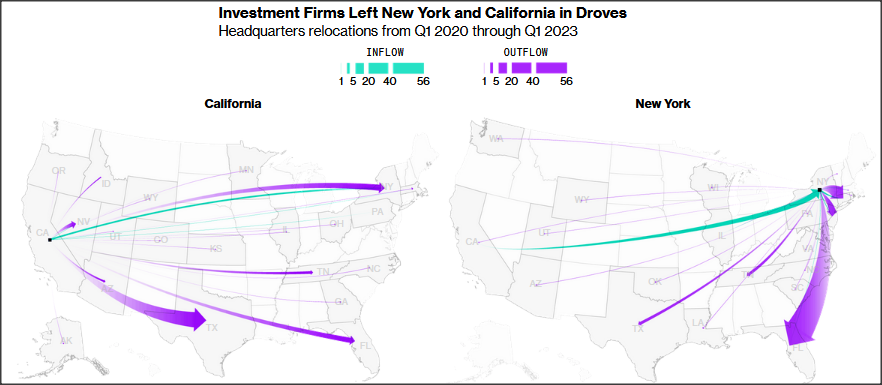
Source: Bloomberg, New York and California Each Lost $1 Trillion When Financial Firms Moved South, August 21, 2023
The loss of this type of financial base is important on two points. First, it represents a shift of a capital source focused on a broader range of industries beyond those typically covered by the venture capital community in Silicon Valley. Second, it reflects the movement of these firms to follow comparable migration by higher net worth individuals—and their above average contributions to the state’s tax base.
Business Trends
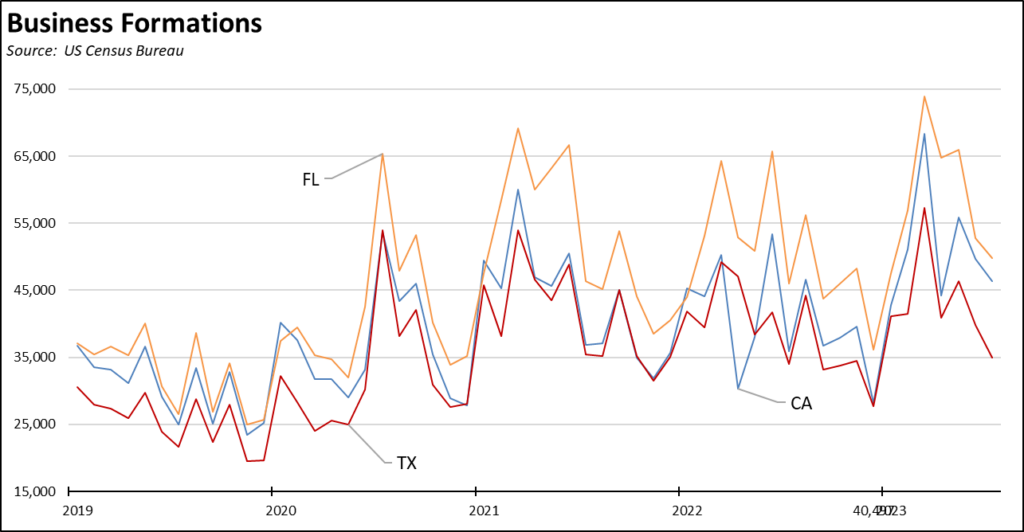
After peaking in March, new Business Formations as tracked by US Census Bureau have declined but in the latest data for July still remain above the average for 2022. Business Formations in Florida continue to surpass California in every month since January 2022. After essentially tracking California beginning in the second half of 2020, Business Formations in Texas have slowed more in the most recent months.
In the Business Employment Dynamics series from US Department of Bureau of Labor Statistics, California continues to lead in the number of establishment births (a firm may have one or more establishments at the same or multiple addresses).
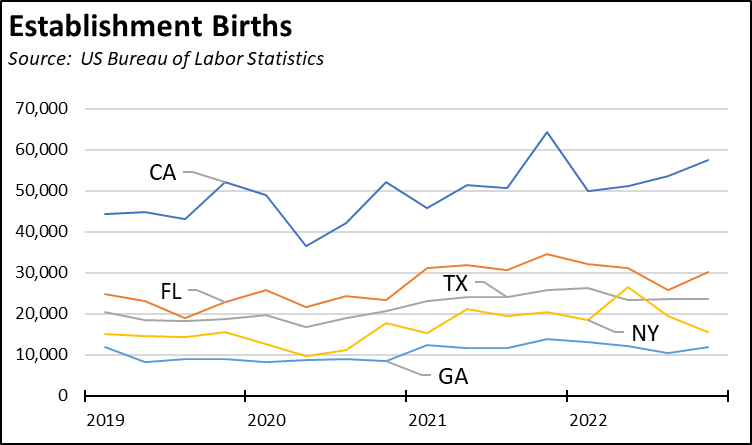
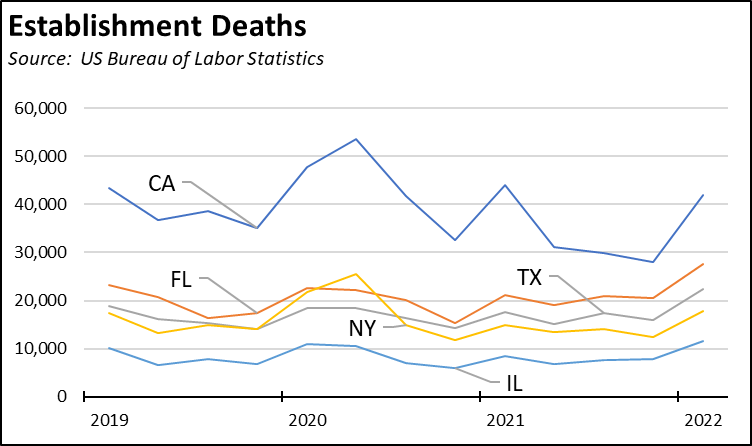
On the flip side, California because of its size also continues to lead in the number of establishment deaths. Note that the establishment death data lags by an additional 3 quarters and is only currently available through the first quarter of 2022.
Adjusted for size, however, California drops to 18th highest for the establishment birth rate in the 4th quarter of 2022, behind Florida which came in 11th but ahead of Texas at 33rd.
The relative growth overall in business formations since the pandemic in general reflects the continuing trend towards workers starting their own businesses, first in response to the wage and salary job closures during the pandemic and subsequently as workers continue to seek greater opportunities for work-life balance.
The ability to grow and expand these businesses, however, differs greatly by state. In a recent ranking by Venture Smarter, California came in 49th among the best states in which to form an LLC, primarily due to the cost of forming an LLC along with the subsequent higher costs due to the state’s tax burden. As detailed in our other reports, operating costs are also higher in California especially for energy. Other features of the state’s operating climate such as the draconian features of PAGA (Private Attorney General Act) remain a potential existential threat to new firms attempting to expand by hiring employees.