The Center for Jobs and the Economy has released our full analysis of the July Employment Report from the California Employment Development Department. For additional information and data about the California economy visit www.centerforjobs.org/ca
Highlights for policy makers:
- Slowing Job Growth Potential
- Preliminary Revisions Show Little Change in Job Estimates
- CaliFormer Businesses
- CaliFormer Businesses: Sunsetting Green Jobs
- State UI Fund Still Running on Debt
Slowing Job Growth Potential
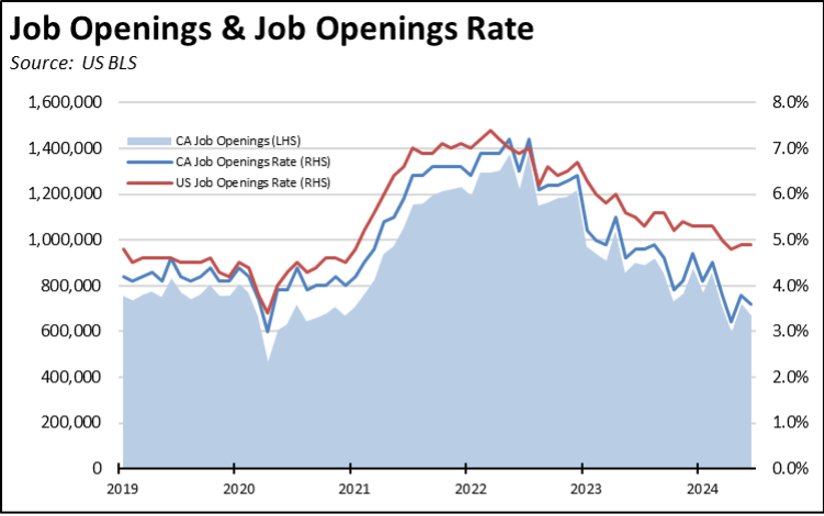
The JOLTS (Job Openings & Labor Turnover Survey) estimates continue to indicate California employers are cutting back on their hiring plans, reducing the likely scale of future jobs growth in the state.
The number of unfilled job openings at the end of June continued the current sharp decline trend, coming in at levels most recently seen during the height of the pandemic in 2020, and comparable to levels experienced in 2017 in the pre-pandemic period. Comparing the job opening rates (job openings as a share of job openings plus total employment), California has diverged strongly from the overall US level which has begun to level off at just below 5.0% as job expansion potential remains higher in the other states.
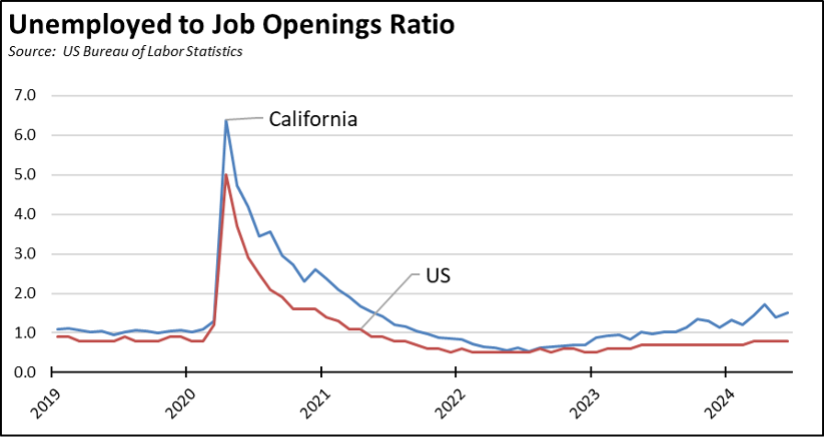
The persistently high unemployment numbers combined with declining job openings now puts California at 1.5 unemployed for every available job opening and rising, compared to the relatively stable rate of 0.8 unemployed per job opening at the national level. California has been the worst state as measured by this metric since last September. This increasing divergence from the rest of the US indicates the challenges the state now faces in reducing its high unemployment levels, while the rest of the country continues to exist in labor shortage.
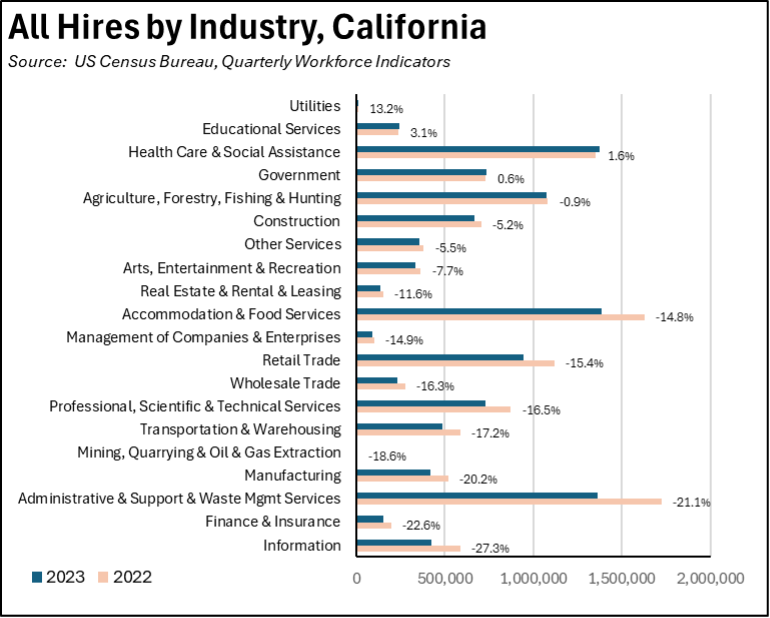
The national JOLTS data provides additional detail by industry, while the state data only covers total nonfarm jobs. Indications of where the California retrenchments are taking place can be seen in another data series, Quarterly Workforce Indicators (QWI). The QWI data, however, is available on a three-quarter lag but is based on actual counts from employment tax filings.
Using the most current data for 2022 and 2023, hiring (both new hires and call backs) showed the greatest slowing in the high-tech industry Information (-27.3%), followed by Finance & Insurance (-22.6%), Administrative & Support & Waste Management Services (-21.1%), and Manufacturing (-20.2%). The 2023 hiring expanded only in 4 industries, led by Utilities (13.2%), Private Educational Services (3.1%), Health Care & Social Assistance (1.0%), and Government (0.6%).
Preliminary Revisions Show Little Change in Job Estimates
The monthly estimates for both the jobs and labor force numbers are based on estimates using models and separate monthly surveys. The job estimates then are subject to annual revisions based on actual counts for wage and salary jobs coming from the Quarterly Census of Employment & Wages. The final revisions for both total nonfarm jobs and the industry breakdowns are released in the first quarter each year. Preliminary revisions for the US are released in August along with preliminary revisions to just the totals for the states and for MSAs with a population of 1 million or more.
The preliminary revision to the March 2024 US nonfarm job estimate at a 818,000 reduction (-0.5%) is substantially higher than in recent years. Industries showing the greatest drop are Professional & Business Services (-358,000; -1.6%), Leisure & Hospitality (-150,000; -0.9%), and Retail Trade (-129,000; -0.8%). The largest upward adjustments are for Private Education & Health Services (87,000; 0.3%), Transportation & Warehousing (56,400; 0.9%), and Other Services (21,000; 0.4%).
The California preliminary revision is substantially lower than in recent years, adjusting total nonfarm jobs up by only 7,700. Earlier estimates by the Philadelphia Federal Reserve Bank had anticipated a downward adjustment of 148,000. The final revisions often are close to the preliminary numbers but have differed in some years.

The preliminary revisions for the covered California MSAs show the largest downward adjustments in the Bay Area:
CaliFormer Businesses
Additional CaliFormer companies identified since our last report are shown below. The listed companies include those that have announced: (1) moving their headquarters or full operations out of state, (2) moving business units out of state (generally back office operations where the employees do not have to be in a more costly California location to do their jobs), (3) California companies that expanding out of state rather than locate those facilities here, and (4) companies turning to permanent telework options, leaving it to their employees to decide where to work and live. The list is not exhaustive but is drawn from a monthly search of sources in key cities.
CaliFormer Businesses: Sunsetting Green Jobs
While California is often touted for its entrepreneurial opportunities, it also leads in the number of business closures as measured by establishment deaths from the Labor Statistics Bureau’s Business Employment Dynamics series. In the latest data, a total of 197,600 California establishments closed up shop in 2023.
A subset of closures, solar energy companies, is of particular relevance to the state’s current climate change programs and continued state claims that this type of green/clean energy jobs is capable of replacing the other jobs being lost in the transition. As tracked by SolarInsure, California has seen 10 solar companies headquartered or operating in the state (out of 17 such firms nationally) declare bankruptcy in 2023 and to date in 2024. Including some of the bankruptcies, a total of 23 California solar businesses closed in that period (out of 56 national closures).
While the reasons for closure vary with each firm, including management practices and in a few cases the quality of products being produced, a key element has been elevated interest rates and their effects on the economics of installing solar in particular for homeowners as well as effects on solar company capital costs. Another more recent element has been shifting subsidy policies, such as the recent Public Utilities Commission change to net metering regulations. The continued reliance of these jobs on substantial subsidies even after nearly 50 years of state policies and subsidies beginning with Jerry Brown’s first terms as governor to promote this technology illustrates the uncertain sustainability from relying too heavily on green/clean energy jobs as the primary source of jobs for the state in the future.
These jobs are being created on a sustainable basis, but in other countries in particular China. Even accounting for recent policy changes to promote domestic production such as the “Inflation Reduction Act,” the International Energy Agency projections expect panel and component capacity and production will continue to be dominated by China.
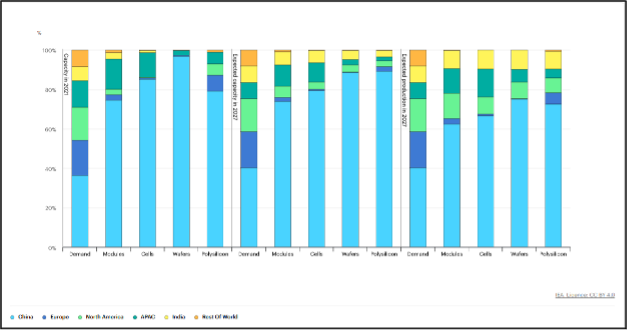
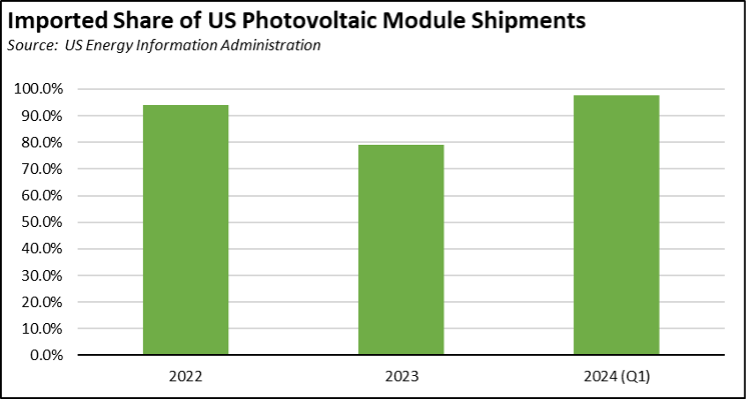
This dominance is reflected in the sourcing of panels sold by US solar companies. As reported by US Energy Information Administration, imported modules moderated only slightly to 79.2% of total shipments in 2023, but following the bankruptcies and closures in this industry bounced back to 97.7% to date in 2024.
State UI Fund Still Running on Debt
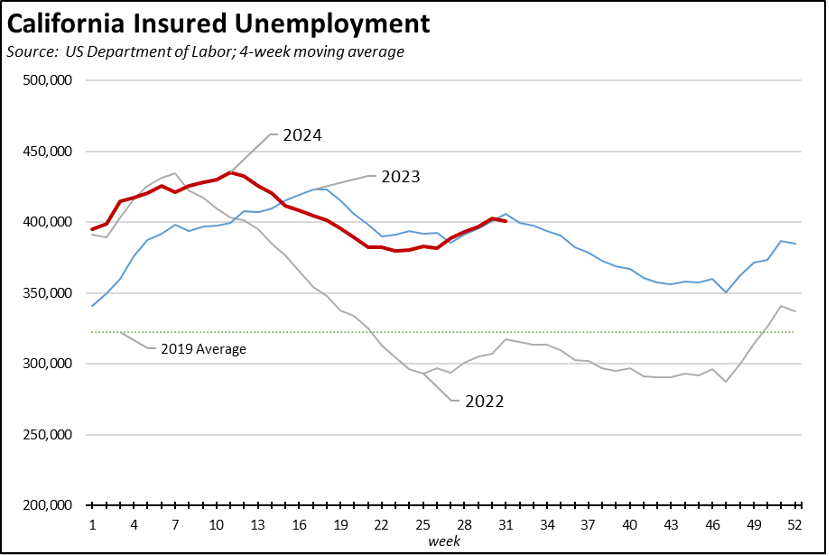
Measured on a 4-week moving average basis, the number of initial claims has moderated from its sharp rise that began at the beginning of June. The overall trend now is tracking closely to the results from 2023 during the same period.

The number of workers receiving unemployment—as measured by insured unemployed (a proxy for continuing claims)—is now tracking even closer with the 2023 trend, remaining substantially elevated above the levels in 2022.
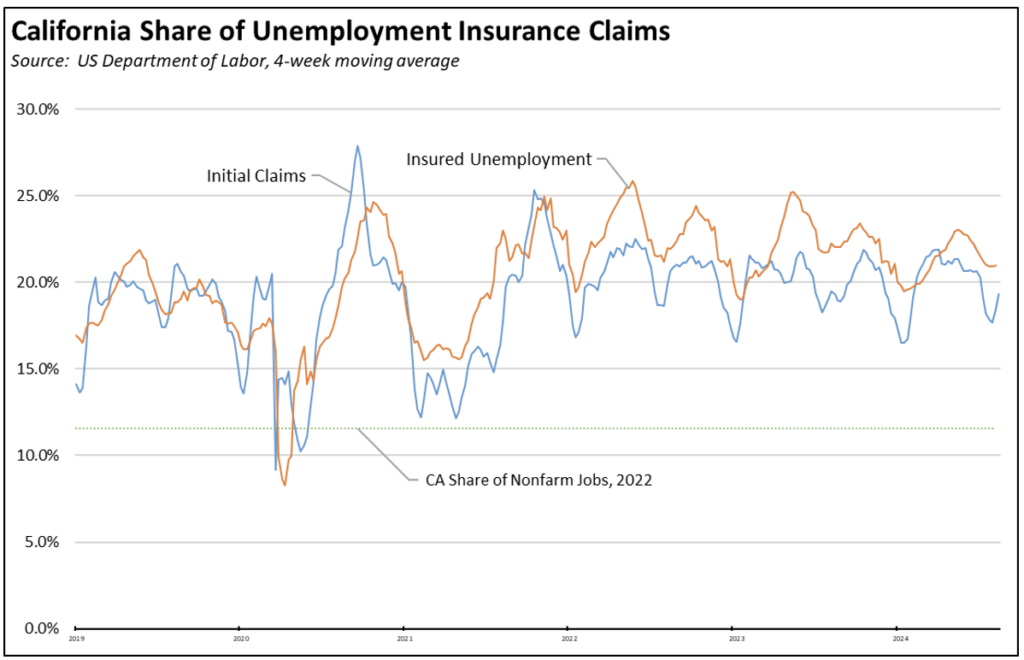
California’s reliance on this program as a substitute for earned wages also remains well above its total share of the national economy.
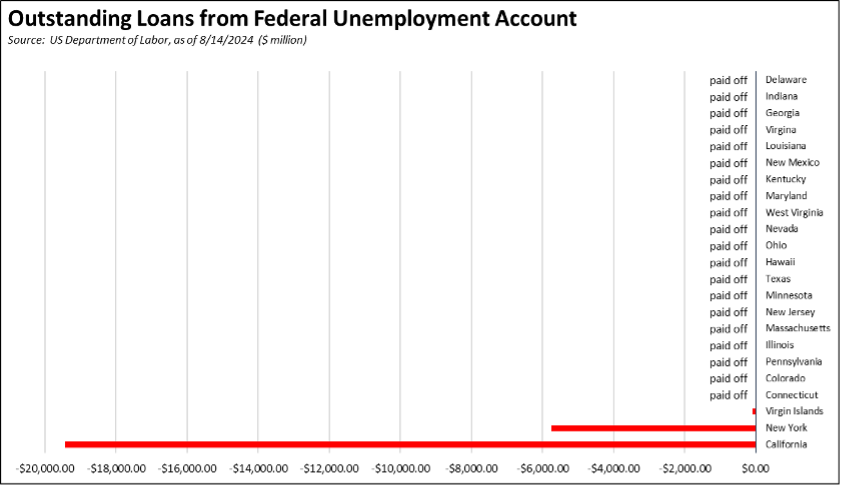
Yet in spite of the importance of this program made even more so by the persistent, elevated levels of unemployment in California, the state fund continues to sink further into functional bankruptcy. California continues to be one of only two states still carrying a UI Fund debt over from the Pandemic, substantially so in the state’s case. The most recent forecast released by Employment Development Department expects the program to pay out 42% more ($2.018 billion) than what it will take in from the Employer Contributions in fiscal year 2024, and 30% more ($1.554 billion) than what it will take in in fiscal year 2025. These forecasts assume no new economic slowdown in this period.
