With the California Legislature returning for the final month of session this coming Monday, the Center for Jobs is releasing this special report, which contains metrics on the current jobs and economic outlook for the state. With recent news about the departure of Chevron and Tesla, and large layoffs by Intel, legacy companies are making major announcements that will affect both the current and future economy, especially the state budget.
This report first analyzes the impact of recently passed tax increases on businesses, including the direct, indirect, and induced job loss, which is estimated at up to 33,000 jobs. Following this analysis, the report addresses various recent claims about the state’s economic prowess, including:
- That the state is #1 for new business starts
- That the state is #1 in access to venture capital investment
- That the state is #1 in manufacturing
- That the state is #1 in agriculture
- That the state has recovered its travel and tourism economy
- And that the state continues to be the 5th largest economy
This report provides key context for these claims, creating a fuller picture and adding key data points that put these claims in a more accurate context.
Connecting Tax Increases to Jobs Loss
Tax Increases Passed in 2024 Will Reduce Jobs and Tax Revenue
Whether the issue is cascading energy costs, rising housing prices, costs of living in general, or as in the current situation growing unemployment and slowing jobs growth, the state’s tendency in recent years has been to ignore or even double-down on the policies causing the problems in the first place.
Not including the MCO tax, the recently passed budget bill will siphon off from all businesses $6.2 billion through the higher business taxes under SB 167 (Committee on Budget and Fiscal Review).
In addition, California businesses also are being charged higher payroll taxes this year and rising in subsequent years due to the state’s neglect in dealing with its unprecedented unemployment insurance fund debt run up during the pandemic as the result of state actions. The nominal amount of this increase is $812 million in 2024, but the past tendency of the state to increase benefits beyond what the state fund can afford combined with current administrative practices in the program means paid benefits are expected to exceed total fund revenues—including those from the tax increase—for at least the next two years. This total stealth tax increase—the $812 million plus the portion shifted into future years through yet even more debt—in 2024 consequently equates to an additional $2.0 billion.
ASSOCIATED JOB AND REVENUE LOSS
Removing this level of capital from the economy also has its own job effects. Using the IMPLAN model for California to assess the numbers for 2024, shifting these resources from the private sector reduces (direct, indirect, and induced) employment by up to 32,900, labor income by $2.5 billion, and state GDP by $4.4 billion. Offsetting the nominal revenue gains, state taxes are lower by $317 million and local taxes by $178 million, for a total offsetting loss of $0.49 billion.
Efforts to offset these costs are anemic at best. For example, in the results to date, CalCompetes provides $1 in capital to only 12 businesses for every $45 taken away from a far larger number of other businesses in the state from the higher business taxes contained in this year’s budget. Adding in the hidden tax paid by business to address the state’s unemployment insurance fund deficit ups the imbalance to every $1 from CalCompetes offsetting $60 taken away in the new taxes.
Fact Checking Recent Economic Claims
Claim: #1 in the Nation for New Business Starts.
California does lead in the number of establishment (rather than business) starts but also leads in the number that have closed. In terms of net additions to its economy, California ranks fourth behind Florida, Texas, and New York in spite of the state’s much larger size.
The reference for this claim links to the US Bureau of Labor Statistics, Business Employment Dynamics (BED) data. While an important indicator series in its own right, this data does not cover business (firm) starts but instead tracks changes in the number and size of establishments. Establishments are discrete units within a firm, and a firm may consist of one or many such establishments including different stores or offices or different operating units at the same location. As such, the BED covers changes within businesses in the state as well as the number of businesses.
Putting this issue aside, the data does show California as the leading state in the number of establishment starts (births). This outcome should be expected as California is also the largest state economy, and much of its business and establishment formation activity in recent years stems from recovery after having the largest negative impacts during the pandemic period as the result of the state-ordered shutdowns.
This is only half the story, however. California also leads the nation in the number of establishment closures (deaths). Using the last full year of data that was recently released (births and deaths have different reporting lag periods), California saw 214,158 new establishments and permanent closure of another 197,600. Combining the two, the net expansion of 16,558 establishments was fourth highest behind Florida with a 65% higher net gain at 27,253, Texas with 19,235, and New York with 17,147. Establishment starts are important, but California’s high propensity to close them down as well pushes it lower in the overall rankings.
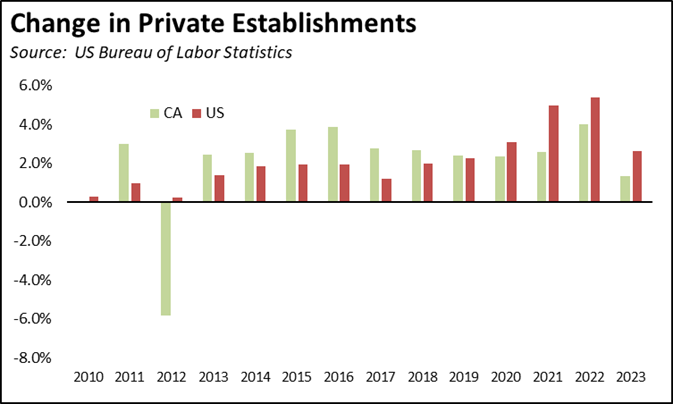
In terms of total establishments, California business formation is seriously lagging the rest of the nation. While the annual change in private sector establishments previously exceeded or matched the overall rate for the US, California has begun to lag in recent years even with the state’s catch-up factor coming from recovery activity related to its deep pandemic closures. In 2023, the California expansion rate was only 1.3% compared to the US average of 2.6%. As measured by this selected metric in the announcement, dynamism is dimming in the state economy.
The number of businesses (firms) in the state is instead measured by other data, in particular the US Census Bureau, Statistics of US Businesses series. This data covers almost all private businesses, organized by location, size, and industry. From the most recent data for 2021:
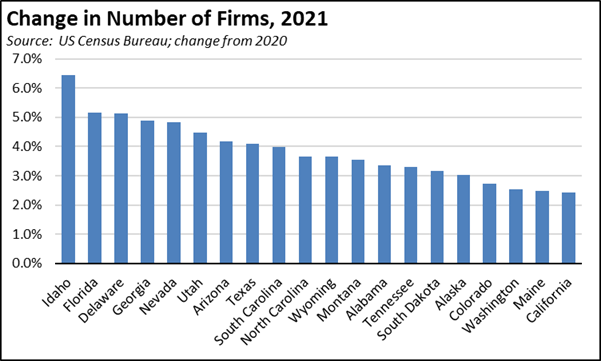
In 2021, the number of firms in California grew by 19,488, behind Florida with 25,051 and barely ahead of Texas with 19,124.

Adjusted for size, California instead ranked 20th, with the number of firms growing 2.4% compared to the overall US average of 2.5%, Florida at 5.2%, and Texas at 4.1%.
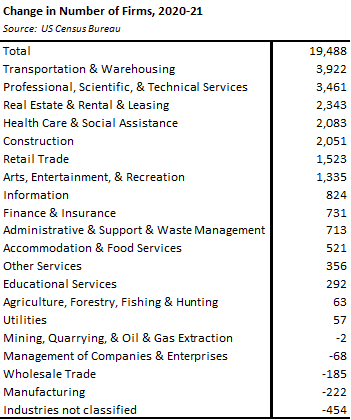
And within California, growth in the number of firms was not led by the primary tech component, Information. That lead instead went to trade-based Transportation & Warehousing. The difference is that trade led the way in spite of actions seeking to hold it back including increased state and local opposition to required infrastructure investments as well as a growing body of state and local regulations increasing operating costs within the state. Number 8 ranked Information in contrast is often cited (see next bullet) as demonstrating California’s innovative spirit. The innovative results are instead found at higher levels in a range of other industries.
Claim: #1 for Access to Venture Capital Funding.
The data supporting this claim cites a 2020 report which is no longer updated. Other sources, however, indicate the state continues to lead in this area although they also show funding has dropped including the virtual dearth of IPOs and other venture exits that led to the current drop in state revenues.
The focus on venture capital, however, reinforces the fact that state has become overly dependent on the outcomes of one industry and more specifically on the outcomes of that industry within a single region of the state while ignoring the effects of its policies on the broader range of the economy and jobs. The Tech industry has been responsible for creating high-wage jobs primarily in the Bay Area, but unlike previous emerging industries such as aerospace, movies & TV, trade, agriculture, and many others, the job effects of Tech have remained limited primarily to that region. Unlike previous development phases that spread beyond their home center to other regions of the state, Tech’s support and ancillary jobs in manufacturing, back office operations, and even data centers have instead gone to other, lower cost states and regions.
The Tech industry is also changing. Estimated employment in this industry since the peak in 2022 has dropped by 94,700 through May. And because the state has essentially focused on supporting this industry to the exclusion of all others, the only jobs that have replaced that loss in this period have come predominantly from government and government-supported Healthcare & Social Assistance. These results are also seen in the state revenues needed to maintain those replacement jobs, which have become overly dependent on this one, highly concentrated source. As venture capital and tech jobs overall have dropped, the state’s $98 billion surplus from just two years ago turned into this year’s $73 billion shortfall.

California’s leadership in venture capital should be a source of pride due to its role in pushing California innovation. But it is not the only source of innovation and by itself has proven to be capable of supporting only a small portion of California’s 19 million workers.
Claim: #1 State for Manufacturing.
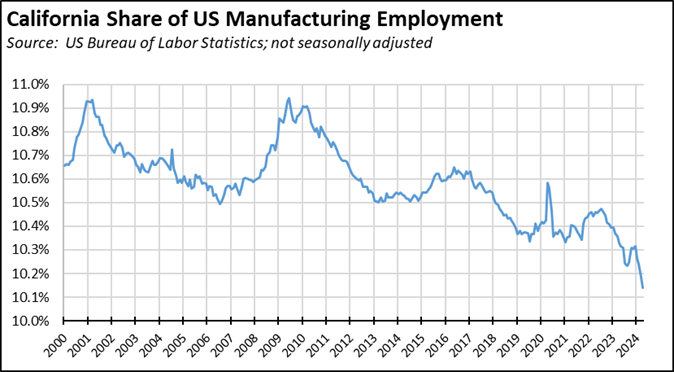
California remains the leading state for manufacturing jobs, but that lead is diminishing as manufacturing shrinks in California and expands in other states.
As indicated above, California experienced a net loss of 222 manufacturing firms in 2021, while our Califormer Business series continues to track a number of manufacturers who have left the state or moved their expansion investments to other states since then. More broadly, California has seen its overall share of manufacturing jobs dropping since the near-term high in 2010. That decline accelerated in the last 2 years and is expected to move down further as the electric vehicle, battery, and chip factories now being constructed in the Southeast, Ohio, and Arizona move into full production
Claim: #1 State for Agriculture.
Measured by total farm production value, the claim is correct. But as with manufacturing, the lead has begun to shrink markedly in recent years:
- Compared to the recent high in 2019, California’s share of total US agricultural production dropped by 2.6 percentage points as agriculture in this state faced increasing challenges for a reliable water supply, soaring costs for electricity, diesel, and natural gas, and the rising costs of increasing regulation.
- Between 2019 and 2022, the value of agricultural production in current dollars rose 18.6% in California, but by 47.4% in the US overall. California’s growth rate in this period was the lowest of any state.
- In real dollars (using producer price index by commodity: farm products), California farm production shrank by 23.6%. In contrast, total US production was down by only 5.0%, and production values grew in 12 other states.

Claim: California’s Travel Spending Reached An All-Time High of $150.4 Billion Last Year.
As stated in an economic impact report from Visit California, travel spending did reach $150.4 billion in 2023, but only as measured by current dollars. In real dollars, tourism remains below the 2019 levels. Tourism spending is growing, but costs in California are growing faster.
The $150.4 billion figure is in nominal dollars and does not reflect the significant inflation during this period and the growing costs of living in or visiting the state. Using the CPI-U as a deflator, spending in 2023 was 12.9% lower than in pre-pandemic 2019 in constant 2019 dollars. Using the Fed’s preferred PCE price index deflator, spending was 10.7% lower in constant dollars.
And while growing, employment numbers for the Tourism industry also indicate that it had not yet recovered in 2023. As taken from that same report compared to previous reports from Visit California, total direct Tourism employment in 2023 was still 21,800 short of recovery.
Claim: California Remains The 5th Largest Economy in the World.
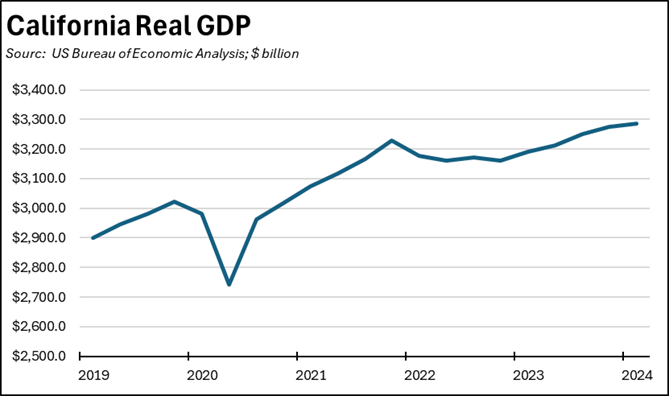
The recent release of the 2023 state GDP data by US Bureau of Economic Analysis confirms that California remained the 5th largest economy. However, California did not become the 4th largest as previously claimed by the Administration. California’s low growth rate in the first quarter of 2024 also suggests it could fall below India and become the 6th largest by 2025 if the state economy continues growing at that rate.
- Relying solely on an opinion piece in Bloomberg rather than any analysis, the Administration quickly claimed that California would soon beat Germany to become the 4th largest economy in 2022. It hasn’t happened. Based on the recent 2023 results and the current world GDP data from International Monetary Fund (IMF), California has remained firmly in 5th place.
- That position is weakening. Looking at the Real GDP series, instead of surpassing Germany, California spent 2022 and the first half of 2023 in recessionary conditions. Real GDP did not resume growth until the 3rd quarter of 2023. The most recent data shows California’s annualized rate growth in the 1st quarter of 2024 was 1.2%, below the overall US average of 1.4% and only 28th highest among the states.
- Going back to current GDP and the current IMF projections, if California continues to grow near the relatively slow rate posted in the 1st quarter, the state would fall below India to shift from 5th to the 6th largest economy by 2025.
