The Center for Jobs and the Economy has released our full analysis of the June Employment Report from the California Employment Development Department. For additional information and data about the California economy visit www.centerforjobs.org/ca.
Highlights for policy makers:
- Recovery Progress
- Job Openings Up 112K
- Unemployment Claims Remain Above 2022 Levels
- Wage Growth Still Ahead of Inflation
- Real GDP Grows Slower than US Average
- Personal Income Misses Budget Projections
- CaliFormer Businesses
Recovery Progress
As discussed in our preliminary report, the June data reported substantial slowing but still fell on the upside. Nonfarm wage and salary jobs (seasonally adjusted) showed gains of 11,600, continuing the pattern over the past year of the first month of each quarter reporting gains in the 60s, only to be followed in the subsequent two months by substantially lower results. Employment (seasonally adjusted) was also low at a gain of only 7,900, continuing what is essentially a stall out in returning workers back to jobs that has persisted since last June.
On a monthly basis, California’s nonfarm wage and salary job gains were the fourth highest among the states and DC. Texas was highest at 31,100, followed by New York at 28,100 and Washington at 11,900. In terms of net jobs created since the pre-pandemic high, California again came in third at 417,300, with Texas at 973,300 and Florida at 658,700. Using the relative growth rate to compare states, California remained in 21st place and essentially matching the national average.
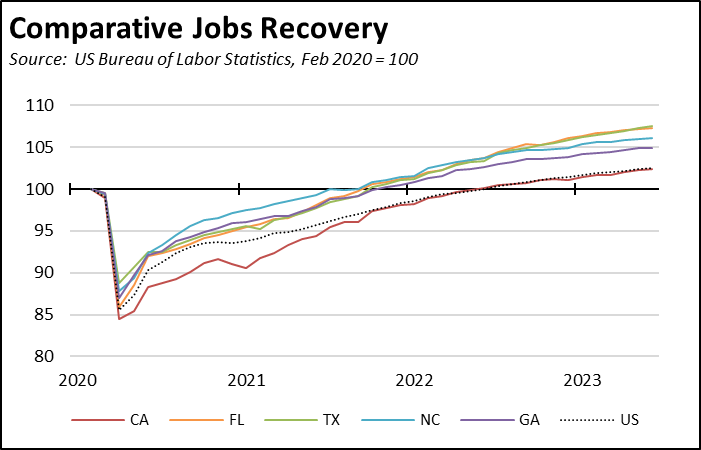
California’s current jobs rate may be sufficient in the long run for a state with a static or shrinking population, but the economic growth center especially for the middle class has shifted to the southeastern states providing lower costs of doing business and for workers, substantially lower costs of living allowing wages to go much farther. In the near and medium prospects, however, California’s current jobs rate has not been sufficient to bring workers back to employment recovery conditions much less economic progress beyond that point as the state’s higher operating costs in particular weigh on the middle class wage jobs.
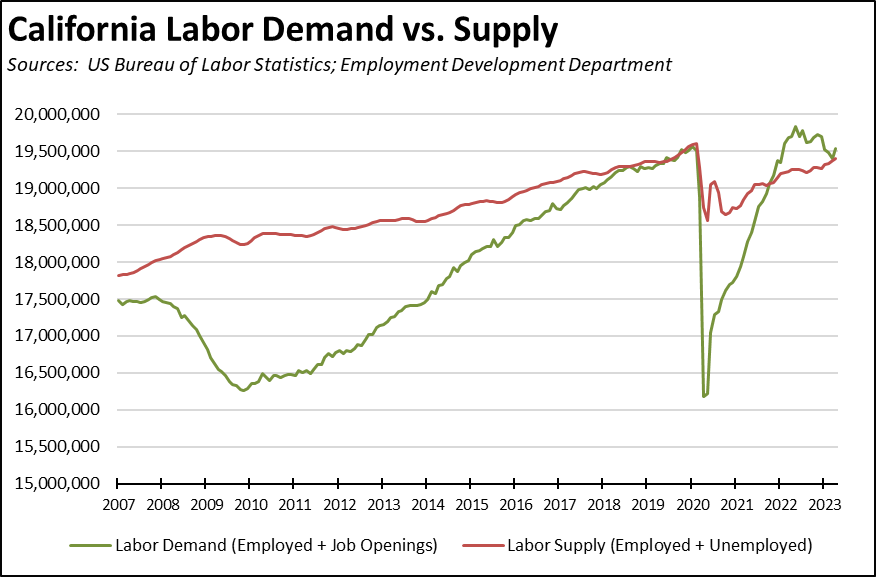
Job Openings Up 112K
While unfilled job openings showed a rebound of 112,000 at the end of April, the potential for stronger jobs growth signaled by this indicator remains muted. The period of excess labor demand is essentially closing, with job openings remaining high primarily due to specific skills shortages—especially in higher wage jobs such as Tech and manufacturing as well as lower wage jobs such as in Leisure & Hospitality—rather than overall shortfalls. Even with the April uptick, California job openings are 25.3% off their peak from May 2022.
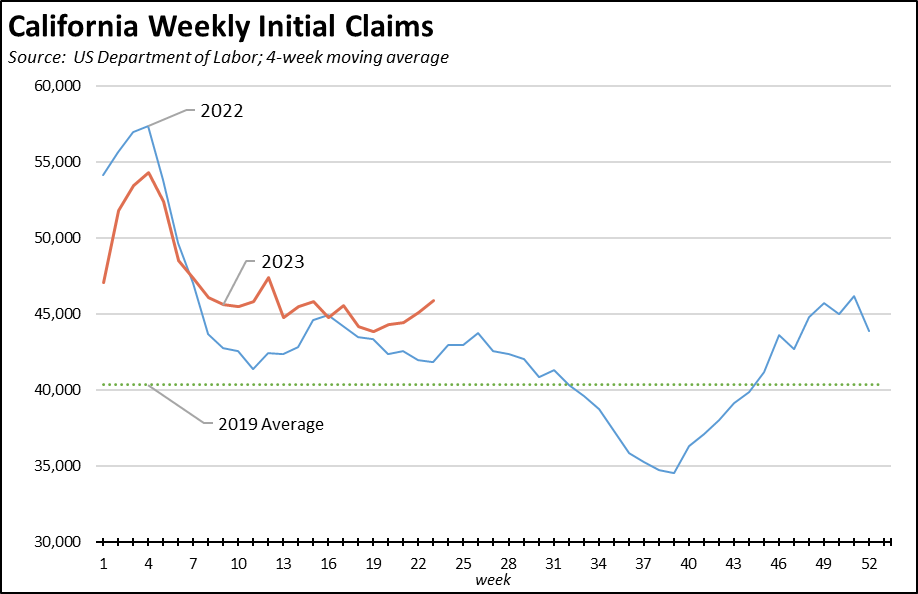
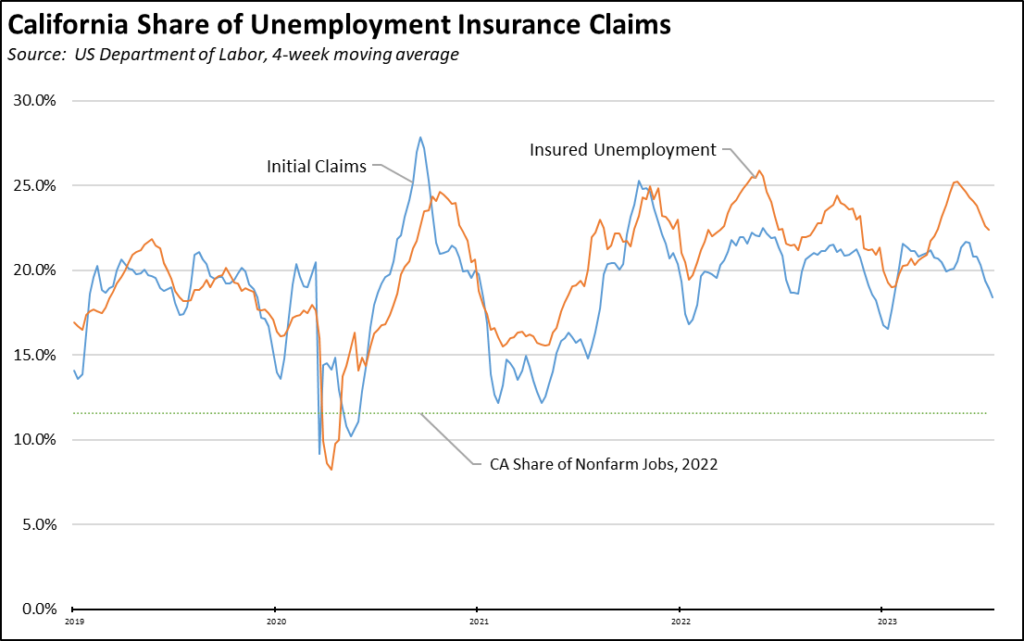
Unemployment Claims Remain Above 2022 Levels
Measured on a four-week moving average, initial unemployment insurance claims remain above the comparable levels from a year ago.
Insured unemployment—a proxy for continuing claims—is even more elevated over the comparable period in 2022, but remains slightly below the near-term peak reached in the week ending May 6.
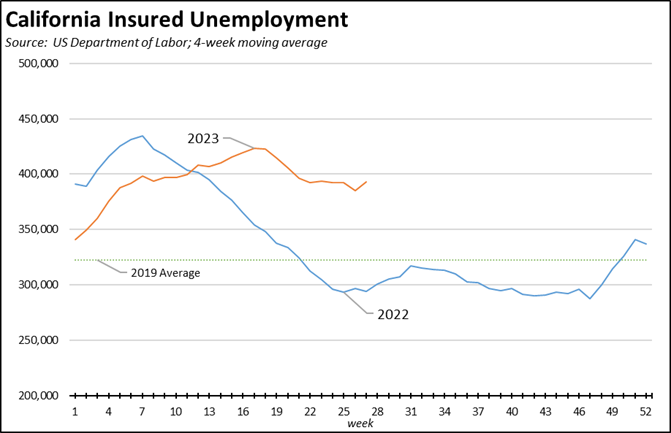
The functioning of this program in California also continues to contribute to weak recovery in overall employment levels. In the latest results (4-week moving averages), California produced 18.4% of all initial claims nationally, and 22.6% of insured unemployment. In contrast, California comprised only 11.6% of all nonfarm jobs.
Even while the state now contemplates taking on additional debt for other purposes, California’s unemployment insurance fund debt continues to grow on its own, reaching $18.0 billion in the latest report for July 18. With even perennially insolvent Virgin Islands paying off its debt, only two states are left with a debt balance from their use of this fund to mitigate state-ordered job closings during the pandemic. By failing to address this debt, the state budget ensures that employers will continue paying the state UI tax at its highest rate schedule. Employers also will be subject to an increase in the federal UI tax, growing at an additional 0.3% to 2.7% annually until the federal debt is paid off.
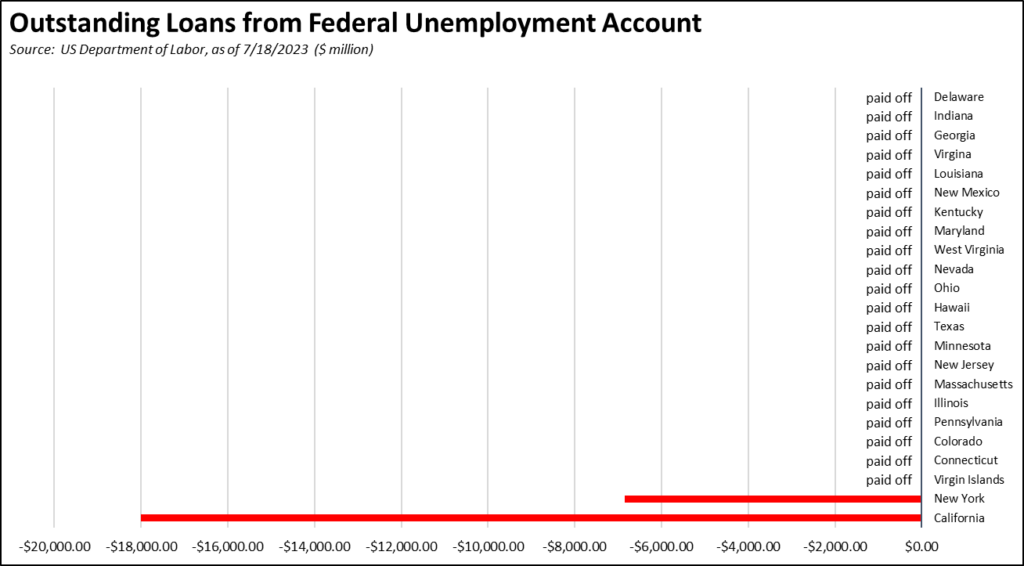
EDD’s more recent fund forecast—with the May forecast publicly released in July well after the primary Budget decisions had been made—expects further deterioration in the fund’s conditions, dropping to an expected $20.3 billion deficit by the end of 2024.
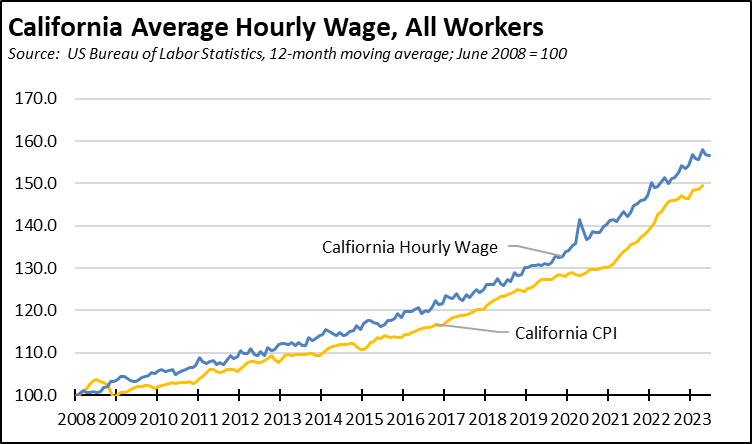
Wage Growth Still Ahead of Inflation
The average hourly wage for all workers (12-month moving average) has shown some slowing in the past few months as lower wage seasonal jobs have produced their typical effect on the average. Considered over a longer term, hourly wage growth remains ahead of inflation as measured by the California CPI. The stronger gains opened up by the pandemic, however, saw significant erosion due to the recent upsurge in inflation.
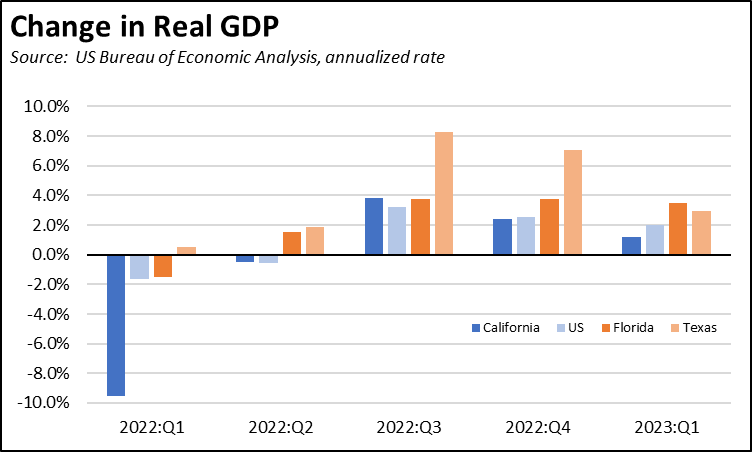
Real GDP Grows Slower than US Average
In the latest release from US Bureau of Economic Analysis, California Real GDP grew at an annualized 1.2% in the first quarter of 2023. California’s growth rate was the 37th highest among the states and DC, and was below the national average of 2.0%.
In the five quarters since 2022, California’s growth rate has exceeded the US average in only two. Florida and Texas have grown faster in each quarter except for the third quarter of 2022 when California and Florida had the same rate.
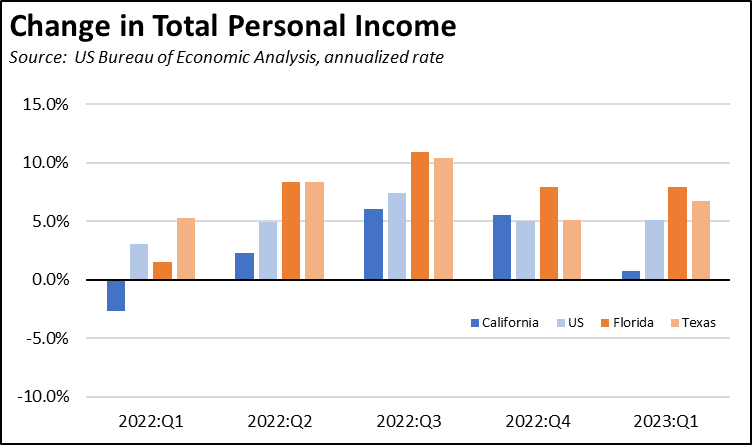
Personal Income Misses Budget Projections
Similar results were seen in the companion release on personal income. Total personal income in California grew at an annualized rate of 0.7%, the 49th highest rate among the states and DC and below the US average of 5.1%. The California performance was also well below the 4.1% rate anticipated in the Department of Finance economic projections underlying the new Budget Bill.
In the five quarters since 2022, California’s growth rate has been better than the US average in only one. Texas and Florida have performed at a higher rate in all quarters except one, when California was slightly above Texas in the 4th quarter of 2022.
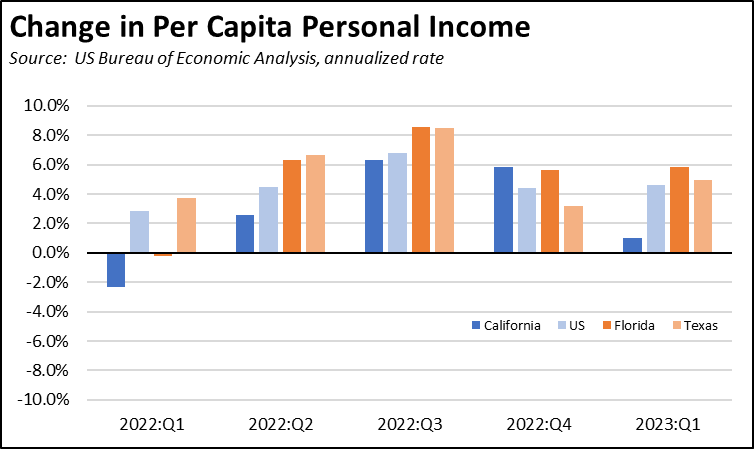
In the first quarter, California had the sixth highest per capita personal income among the states and DC, the same rank the state held in the first quarter of 2020 just prior to the pandemic. Per capita income, however, grew at an annualized rate of 1.0%, below the US average of 4.6% and 49th highest among the states and DC.
In the five quarters since 2022, California per capita personal income grew faster than the US average in only one. Texas and Florida showed higher improvement in four of the quarters.
CaliFormer Businesses
Additional CaliFormer companies identified since our last monthly report are shown below. The listed companies include those that have announced: (1) moving their headquarters or full operations out of state, (2) moving business units out of state (generally back office operations where the employees do not have to be in a more costly California location to do their jobs), (3) California companies that expanded out of state rather than locate those facilities here, and (4) companies turning to permanent telework options, leaving it to their employees to decide where to work and live. The list is not exhaustive but is drawn from a monthly search of sources in key cities.
| Companies | From | To | Reason | Source | |
| LS Electric Co. | Irvine | Texas | Manufacturing expansion | https://www.bizjournals.com/austin/news/2023/07/11/ls-electric-samsung-supplier-bastrop-austin-taylor.html | 2023 |
| Sierra Pacific Windows | Anderson | Alabama | Manufacturing expansion | https://www.bizjournals.com/birmingham/news/2023/05/17/sierra-pacific-windows-adding-facility-jobs.html | 2023 |
| Skillz | San Francisco | Nevada | HQ move | https://lasvegassun.com/news/2023/jun/07/esports-specialist-skillz-moving-its-headquarters/ | 2023 |
| Unical Aviation Inc. | Industry | Arizona | HQ move | https://www.bizjournals.com/phoenix/news/2023/07/18/unical-aviation-aircraft-glendale-303-phoenix.html | 2023 |
| Yakult | Fountain Valley | Georgia | Manufacturing expansion | https://www.bizjournals.com/atlanta/news/2023/07/18/yakult-bartow-county-investment.html | 2023 |