Highlights for policy makers:
- Nonfarm Jobs Dip 2,900—Ranking 49th Among the States & DC
- Lagging Job Numbers Produce 419,000 Surplus Workers
- Key Industries
- Reduced Hours Offset Wage Increases
- Job Prospects—Business Trends & Outlook Survey
- Tied for Highest Unemployment Rate Among the States
- Estimated Unemployment Rates for Legislative Districts
- Unemployment Insurance Initial Claims Continue to Track Lower—State Debt Continues to Track Higher
Nonfarm Jobs Dip 2,900—Ranking 49th Among the States & DC
As indicated in our preliminary report, nonfarm jobs dipped a preliminary 2,900 in June, while the May results were revised from a gain of 3,100 to a loss of 15,600. June marks the 4th out of the past 5 months where the change in jobs was zero or below.
California’s job performance ranked 49th among the states and DC, which were led by Texas (43,400), Minnesota (13,200), and Florida (11,100).
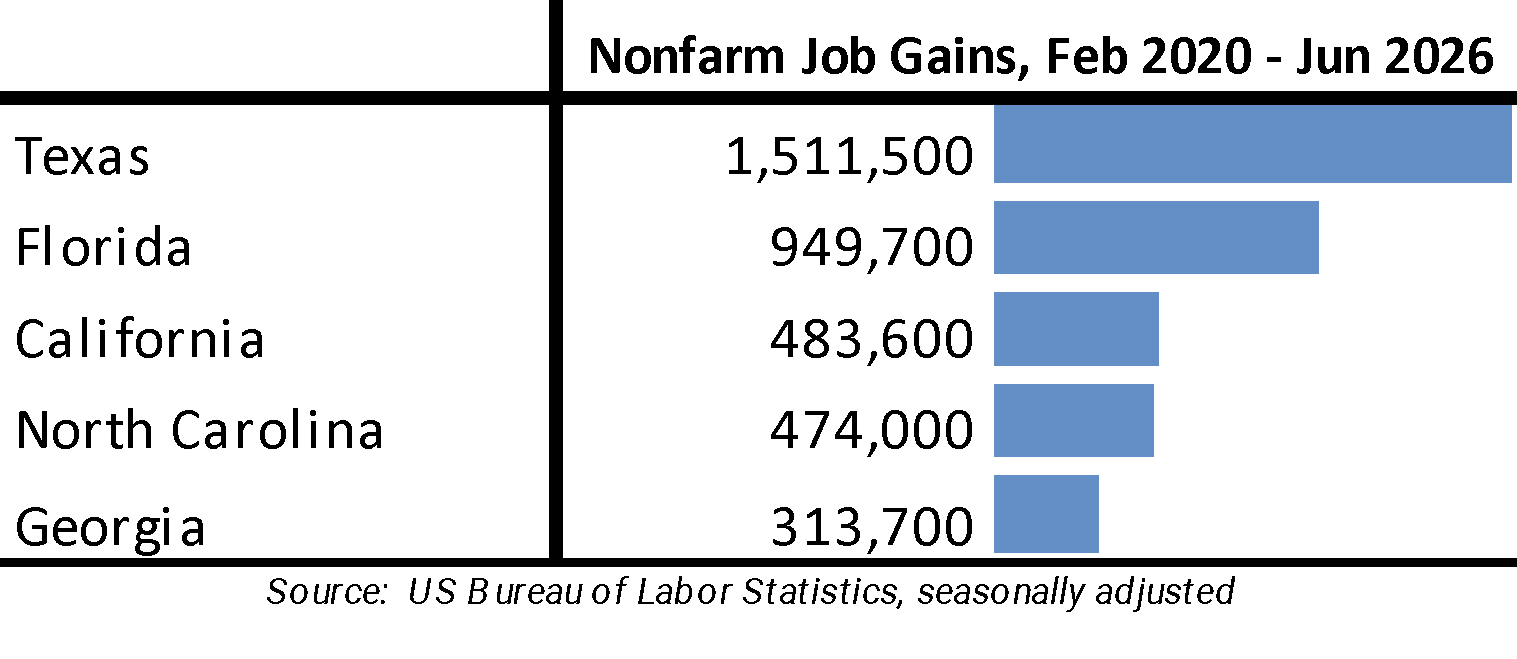
Despite California’s weak jobs performance over the past 5 months, the state still ranks 3rd when measured by net job gains since the pre-pandemic peak. California, however, just barely remains in this position with only 9,600 jobs more than much smaller North Carolina.
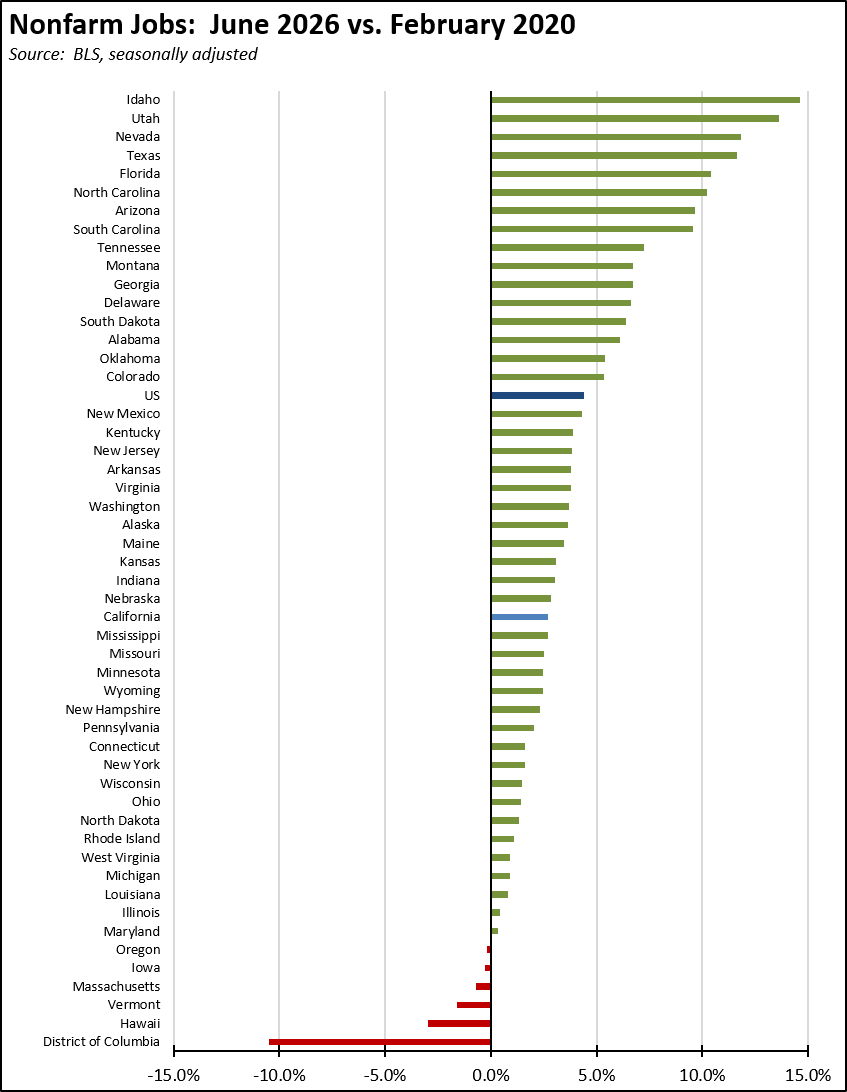
Adjusted for size, California remained ranked 28th in jobs performance since the pre-pandemic peak. Five states and DC still remain short of recovery levels.
Lagging Job Numbers Produce 419,000 Surplus Workers
The Job Openings & Labor Turnover Survey (JOLTS) provides information on the near-term jobs potential in the state by measuring the number of unfilled job openings at the end of each month. Bureau of Labor Statistics has shifted the state data release from monthly to a far less useful annual schedule, with the latest data release updating the results through December rather than providing additional months in 2026.
Using the revised data, California unfilled job openings were raised to 724,000, down 15.3% from December 2025 but showing an increase over the previous 5 months. This level translates into 1.6 unemployed for every available job opening, the 3rd worst outcome among the states which were led by Washington (1.8) and Nevada (1.7). The US average in December indicated a small supply imbalance at 1.1 unemployed per job opening, but since has improved to 1.0 in the most recent data for May.
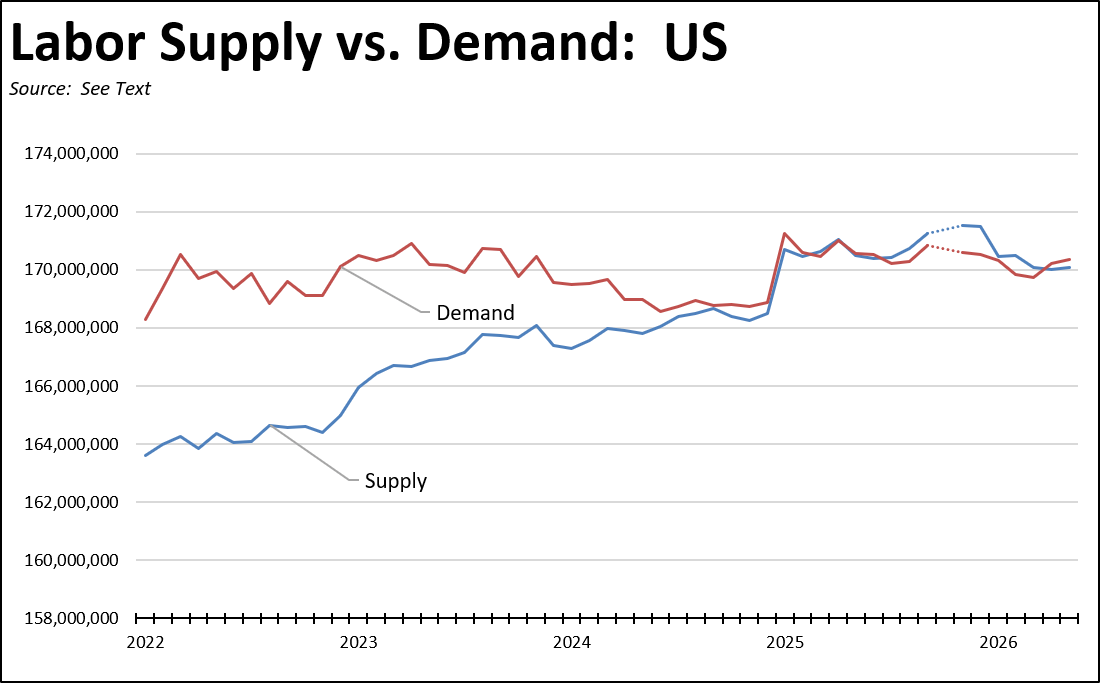
Combining the JOLTS and labor force data provides a measure of labor supply and demand, with supply measured by the number of employed and unemployed and demand measured by employment and job openings (all measures seasonally adjusted). California’s persistently high levels of unemployment from this perspective can be explained at least in part by the state’s lagging jobs picture, both actual as measured by employment and potential as measured by job openings as job turnover remains low due to economic concerns and as businesses remain cautionary on expansion plans within the state. As indicated in the chart, labor demand largely stabilized in the second half of 2025 but at levels well below those seen in the first half of 2023. Labor supply has since dropped by 258,700 as discouraged workers have left the labor force.
Measuring the difference between the two curves, California had 419,000 surplus workers in December (2.1% of labor supply), the 6th highest level since the state passed market equilibrium levels in early 2023.
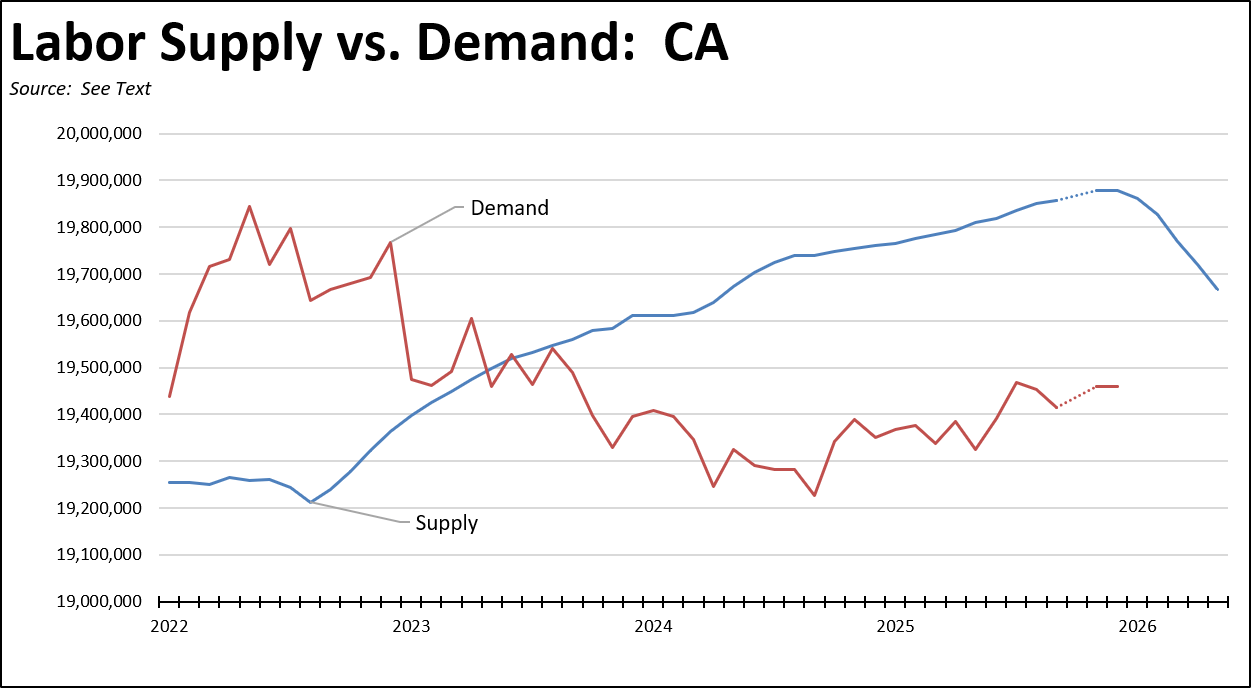
By comparison, the US total also showed a small surplus of 953,000 (0.6% of supply) in December, but has since returned to a small positive balance indicating a need for additional labor force in the other states while California remains mired in jobs-poor conditions.
Key Industries
The lagging jobs picture extends to many of the state’s key job centers. The following charts provide updates on key industries from our Economic Performance Review report from December. To provide more current estimates, most data uses the not seasonally adjusted Current Employment Statistics equivalent categories rather than the Quarterly Census of Employment & Wages (QCEW) data used in the December report.
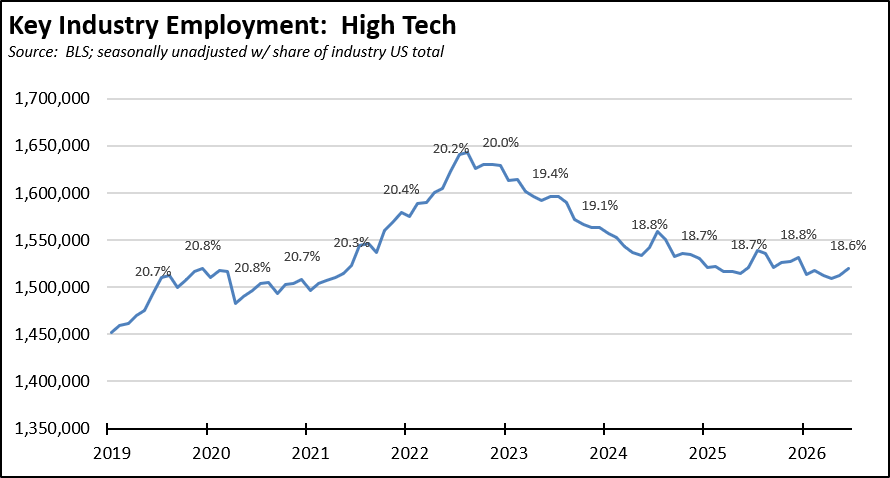
High Tech jobs in June were down 1,300 compared to June 2025, and 123,000 lower than the previous high. As the result of the industry’s shift to other states, California’s share of national employment in this industry continued falling to 18.6% in the second quarter.
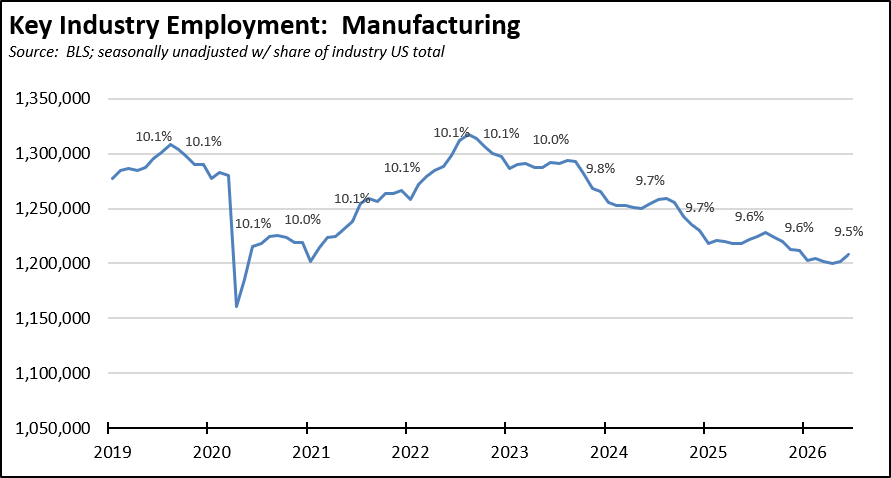
Manufacturing jobs were down 12,700 compared to last June and 108,900 compared to the previous near term high. While California remained the largest manufacturing state, its share of US jobs fell to a new low of 9.5%.
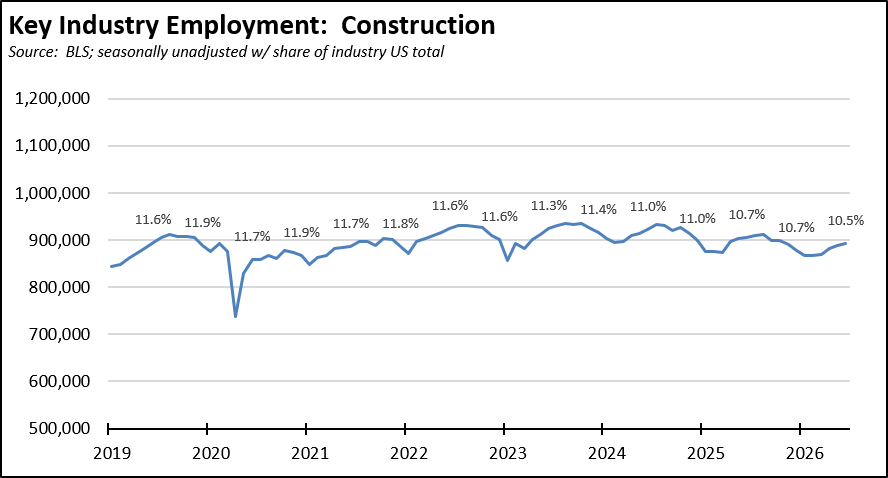
Construction jobs fell 13,400 compared to last June and were 42,500 lower than the near term high. Reflecting the shift of population and development levels to other states, California’s share of US jobs fell to 10.5% in June, below its overall 11.4% share of all nonfarm jobs.
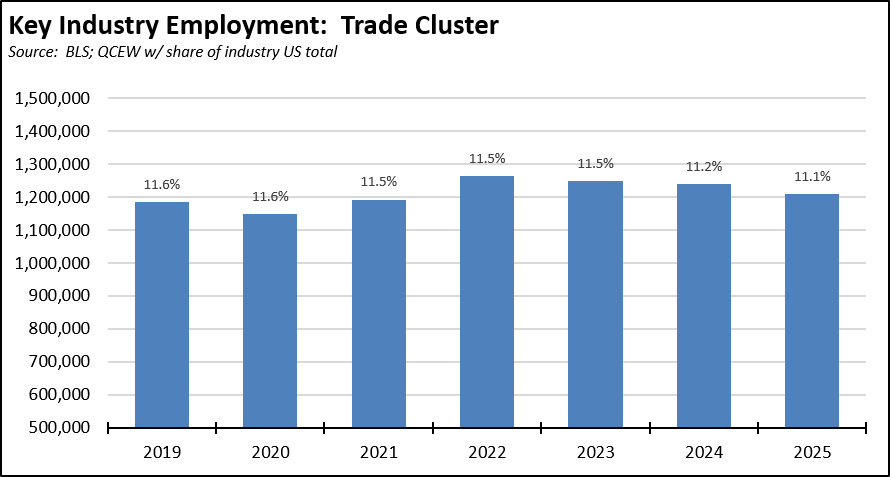
Trade Cluster jobs were down 28,700 in 2025 compared to 2024, and down 53,600 from the near term high. As other states expand their port and intermodal infrastructure to capture more of the global trade flows, California’s share of these largely blue-collar middle-class wage jobs notched down to 11.1%. The chart below shows only annual levels as Rail jobs are not included in the QCEW data and instead are taken from the annual Occupational Employment & Wage Survey experimental estimates.
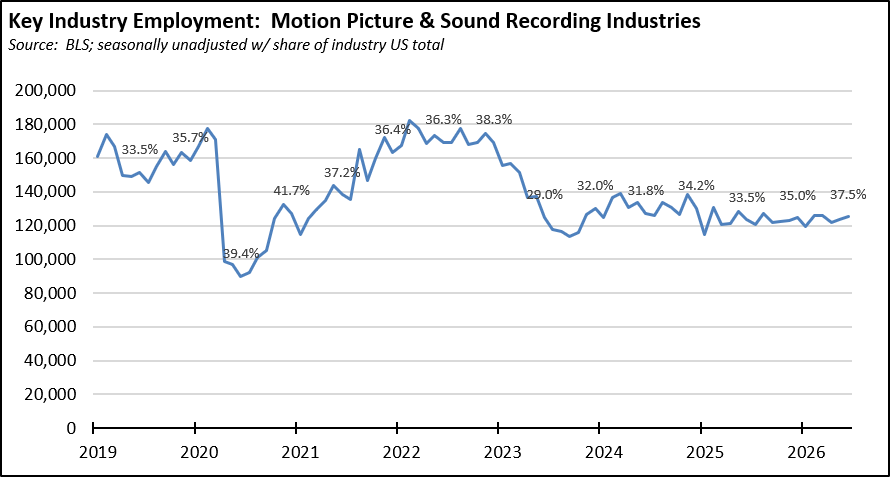
Motion Picture & Sound Recording Industries jobs were a marginal 1,800 higher than last June, but were 58,600 below the near term high in a continuance of the post-2023 strike lows. The share of US jobs was at 37.5%, comparable to pre-strike levels and reflecting the situation that while production has moved out of California, it has moved to lower cost countries as well as to lower cost states.
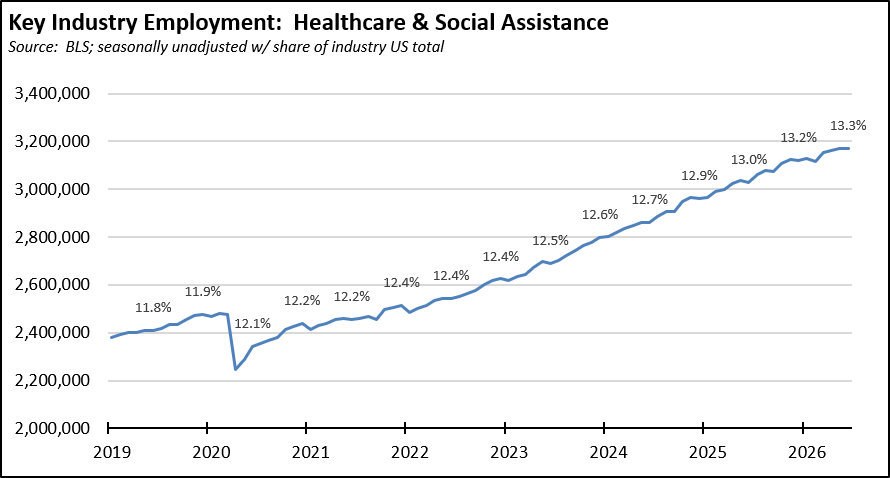
In contrast to the previous core drivers of the state’s economy, Healthcare & Social Assistance continues to provide all or nearly all of the state’s jobs growth. In June, these jobs rose 145,500 over the year and reached their all-time high. Reflecting the continued rise in state funding—including through new taxes on households and the other job critical industries in the state—for these programs, these jobs also reached a new high of 13.3% of the US total, well above the state’s 11.4% share of all nonfarm jobs.
Total jobs in this industry rose 780,300 (21% of the total US gain) during the period shown in the chart. While higher paying jobs in the other industries shown above have been in decline, 40% of this industry gain came from state-funded, minimum wage and part time In Home Supportive Service jobs that will continue to exist only as long as those state funds continue to be supported by the state’s tax-paying base.
The perversity of what passes for state jobs policy is illustrated in the previous charts. Films and TV, while an important industry to Southern California, produces only 125,200 direct jobs (June 2026). Research & Development, as discussed in our August 2025 report, in contrast produced 697,500 jobs in 2023 and is at the base of the competitiveness and future growth curve of the far more numerous jobs in Manufacturing, High Tech, Trade, and other industries. Yet recent state tax actions ignore these relative economic weights. The film tax credit was recently expanded to $750 million while the R&D tax credit was severely limited through a $4.5 billion tax increase in the state’s never-ending quest to find yet something else to tax to sustain the rise in Healthcare and Social Assistance jobs. That other key and currently declining job centers may be restricted in the process does not seem to come into the tax policy equation.
Reduced Hours Offset Wage Increases
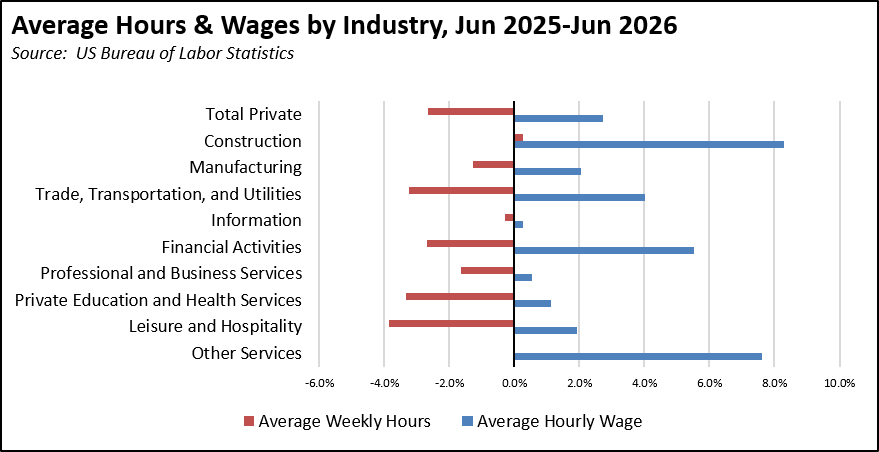
In the seasonally unadjusted data, private average hourly wage rose 2.7% over the year, ranging from 0.3% in Information to 7.6% in Other Services. These higher labor costs, however, continued to be offset by a reduction in average weekly hours in most cases, with an overall loss of 2.7% for all private sector jobs but a positive balance for Construction, Other Services, Financial Activities, and Manufacturing. Combined with further offsets coming from 3.5% inflation in this period, as measured by US CPI, weekly earnings saw no real gain over the year.
Job Prospects—Business Trends & Outlook Survey
Since September 2023, the US Census Bureau has been conducting a high frequency survey of business conditions under its Business Trends & Outlook Survey, covering both a standard group of questions along with others related to current events such as natural catastrophes and AI adoption. The survey covers about 1.2 million businesses split into 6 panels that respond sequentially over a 12-week period. The data covers all employer businesses in the US except farms. Responses by industry are available at the national level but not state. As with the other economic surveys, there is a gap during the government shutdown last October.
The following table summarizes the responses for selected questions from businesses in the 5 top job producing states and the US, comparing the two most recent responses from the same panel:
Looking at current business performance, California businesses are more pessimistic than the other states and the overall US average, with the lowest share of businesses facing favorable conditions and the highest share seeing unfavorables. California businesses are nearly equally split on favorable and unfavorable, while the other four states and US overall show a greater share of excellent/above average, significantly so in the case of fast-rising North Carolina.
The same pattern is seen in hiring expectations, with California being the only case where more businesses are expecting to reduce workers than add. Reflecting its lagging jobs conditions, California in fact has the 6th lowest share among all of the states of businesses indicating plans to increase workers in the next 6 months, although 9 states have insufficient responses to show a significant entry on this question.
The same pattern is also seen on the question of hours for existing workers, with California the only case with more businesses expecting to reduce hours worked rather than increase them. California’s spread has improved somewhat, while the national numbers and in Georgia and North Carolina have narrowed.
There are fewer differences on expected price increases, with Georgia showing the largest difference from the US average. Combined with the previous questions, however, California shows expectations of higher costs combined with the weakest prospects of the jobs growth households need to accommodate them.
Tied for Highest Unemployment Rate Among the States
In June, California’s 5.2% unemployment rate (seasonally adjusted) tied with Oregon and Washington for the worst unemployment rate among the states. DC again was higher at 6.0%.
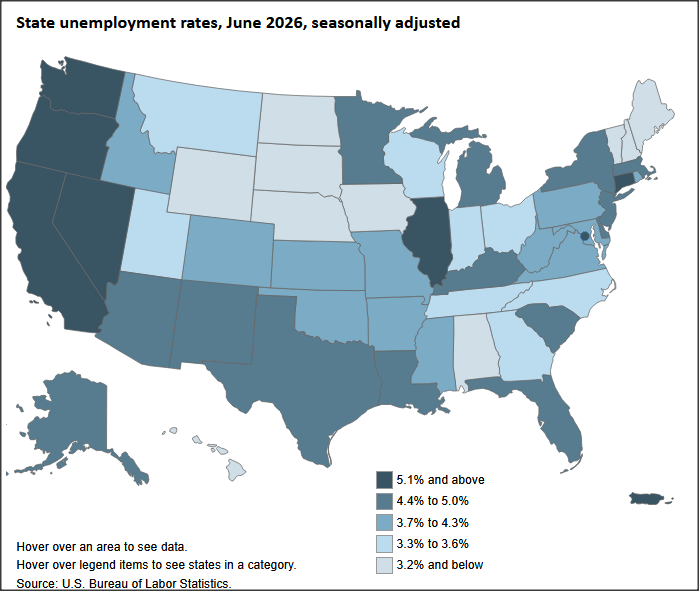
While June’s 5.2% rate is marginally improved compared to the 5.3% from May and the 5.5% level that prevailed through much of 2025, this improvement has come as workers left the labor force rather than finding employment. Overall, employment (seasonally adjusted) has fallen 189,600 since the peak last November, and remains 172,700 short of recovery to the pre-pandemic level. The total number of unemployed has remained above the 1 million mark since January 2024.
Adjusting for workers who are no longer in the labor force, June’s unemployment rate would instead factor out to 6.1%, higher than even DC.
Estimated Unemployment Rates for Legislative Districts
Unemployment Insurance Initial Claims Continue to Track Lower—State Debt Continues to Track Higher
Nationally, initial claims (seasonally adjusted) fell to their lowest level since 1969, while California claims (unadjusted) continued to track below the same point in recent years. All California data below is based on 4-week moving averages.
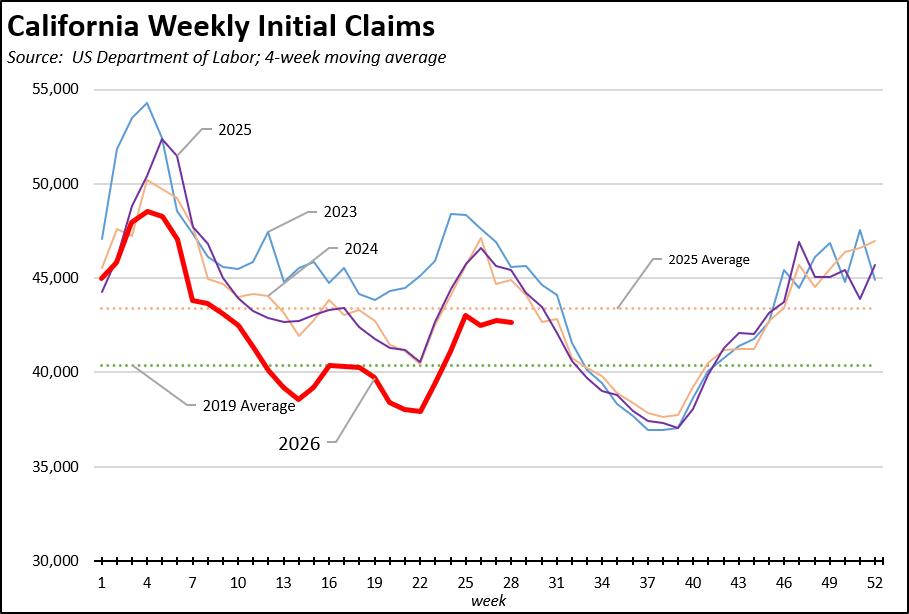
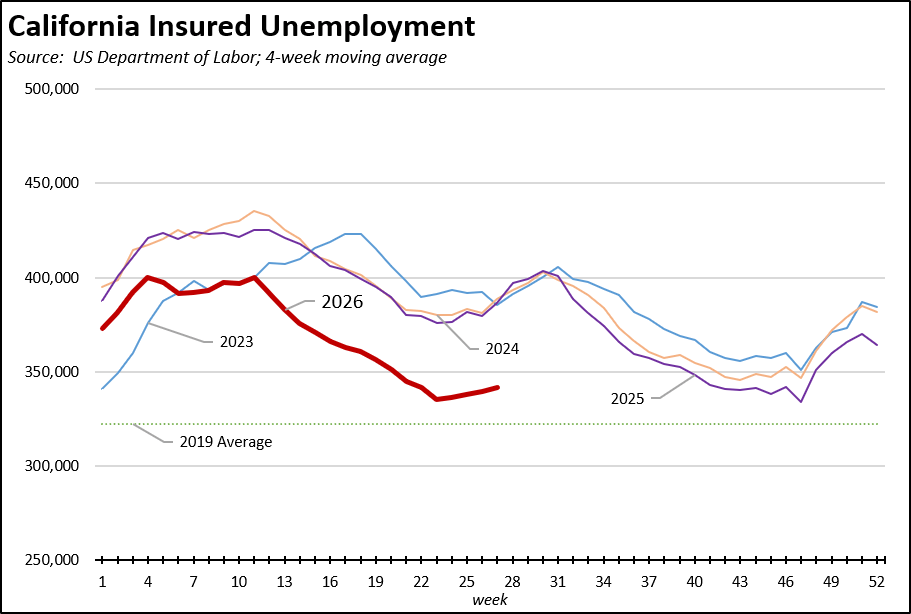
As did insured unemployment, a proxy for continuing claims.
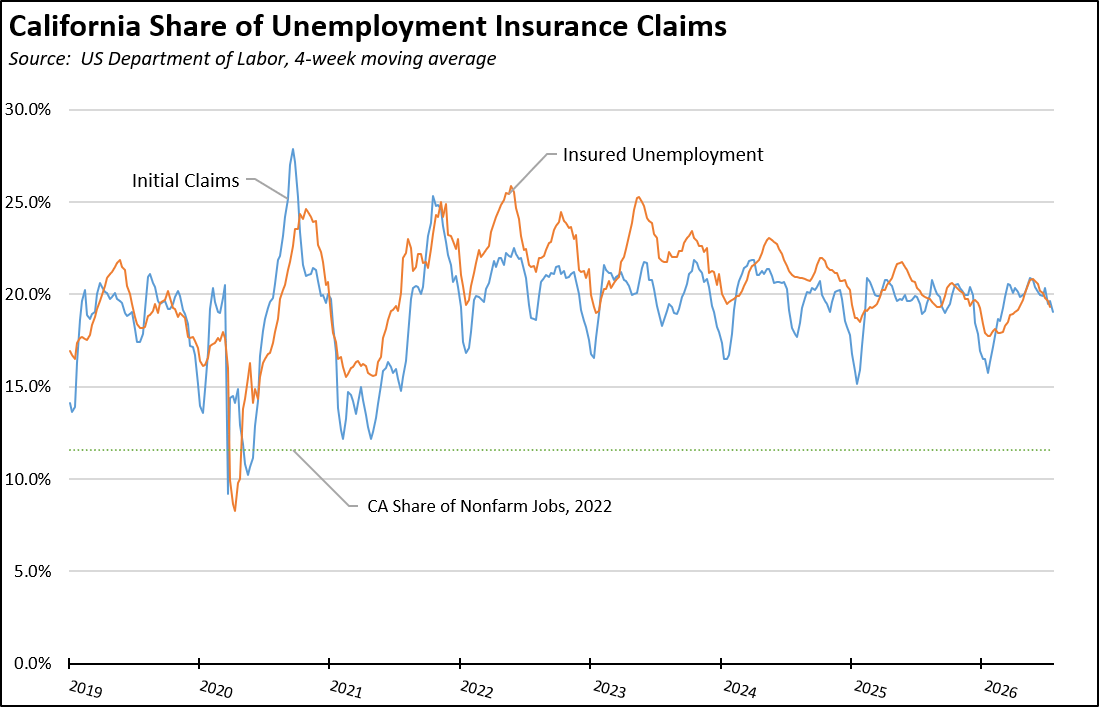
California’s administration of the program, however, ensured that usage remains well above national norms. Compared to the state’s 11% share of total jobs, both initial claims and insured unemployment continue to trend around a fifth of the national totals.
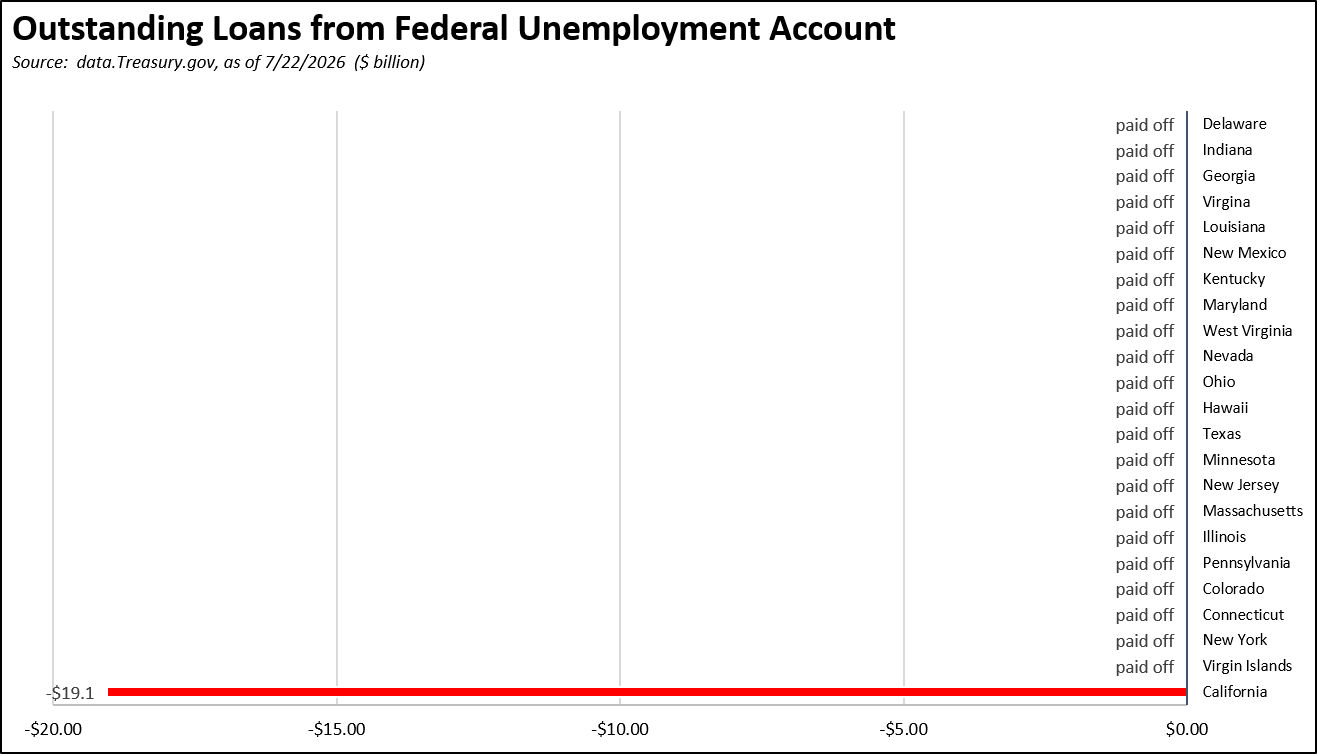
California, as the only state to still carry an Unemployment Insurance Fund debt, falls well beyond the national norm. Since our last report, the Fund debt grew another $611.9 million to $19.1 billion despite employers within the state paying an estimated $2.0 billion in higher employment taxes this year.