Recovery Progress
As discussed in our preliminary report on the March jobs and labor force data, the latest results at best suggest a slowing in the state economy. Putting aside the monthly loss in December, the March nonfarm jobs gain at 8,700 (seasonally adjusted) was the lowest since September 2021, following on the sharp downward estimates in both the January and February numbers.
Compared to the pre-pandemic peak in February 2020, California nonfarm jobs only show a net gain of 295,200, or well below the 867,900 posted by Texas and 624,000 by Florida but still ahead of 4th place North Carolina (265,700) and 5th place Georgia (207,700). Looking at just these 5 states ranked the highest by net job gains since the previous peak, the stronger performance in the other four reflects the results of covid-era job closures that did not cut as deep as California’s combined with subsequent policies that emphasized a much earlier return to work.

Employment, while the March data showed some improvement to the overall labor force, only returned back to the level previously seen last June. California employment (seasonally adjusted) has essentially stagnated since that point rather than continuing progress towards a recovery level.

As reflected in the job openings data, the potential for substantial jobs expansion is beginning to show some closure as firms begin to cut back on hiring plans and as the supply of labor remains an issue. While labor demand (employed plus unfilled job openings) continued to exceed the labor supply (employed plus unemployed) through February especially when taking into account the likely level of frictional unemployment, the difference is narrowing but primarily due to steep drops in job openings in January and February.

Recovery Progress by MSA
Net job gains compared to the prior peak are heavily concentrated within only a few MSAs, led by the Inland Empire with 27% of the total. Eight MSAs/Metropolitan Districts (MD) still fall below this recovery level, led by Contra Costa and Los Angeles Counties.
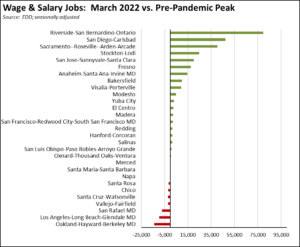
Looking at employment, California’s remaining shortfall is dominated by Los Angeles County.

Recession Watch
While the March data remained positive if slowing, the prospect of a recession remains, with the recent Fed minutes indicating an expectation for a mild recession beginning later this year. Other sources generally indicate slightly better performance than previously expected for the first quarter, but with slowing likely leading to a recession by the end of the year:
- The Atlanta Fed’s GDPNow model has been showing a somewhat improving picture for the 1st quarter, with the most recent April 18th estimates of 2.5% GDP growth in the first quarter.

Source: Atlanta Federal Reserve Bank
- The most recent Economic Outlook Index from the national Business Roundtable indicates CEOs expect GDP to slow but still remain positive in 2023, at a 1.4% gain. This survey, however, was taken prior to the Silicon Valley Bank bankruptcy and the most recent Fed action.
- Wells Fargo recently upgraded their expectations to 1.8% growth in the first quarter, but continues to expect a “modest recession” with a real GDP drop of around 1.2% between Q3 2022 and Q1 2024.
- The most recent Leading Economic Indicators release from The Conference Board similarly signals a recession over the next 12 months.
- A new Census Bureau Index of Economic Activity, combining 15 of their primary data tracking series, has begun to move into negative territory, with the most recent reading as of April 24 at -1.07.

- Falling wholesale diesel prices elsewhere in the nation reflect a slowdown in freight traffic, which in turn is signaling a downturn in overall economic activity.
Recession Watch: California
For California, the question of where a downturn occurs is just as critical as whether it is going to happen. As discussed in previous reports, the Bay Area and in particular the tech industry is the critical determinant in overall economic performance—GDP growth for the rest of the state has generally matched or in some years lagged the US average—and the overall health of state revenues—with only 19.2% of total population, the Bay Area produced 43.2% of resident personal income tax in 2020.
In the current situation, the Bay Area is now leading in layoffs, similar to but not at the same level as the actions that led to the Dot.com recession at the beginning of the 2000s. These slowdowns are already beginning to be reflected in state revenues, with the lower projections in the January Proposed Budget largely the result of lower bonus levels and reduced capital gains due to the stock market performance and diminished tech industry IPO activity. While the value of state revenues as an indicator has been diminished by the various tax deadline extensions, the most recent cash flow report from Department of Finance for April shows tax withholding—an element largely unaffected by the deadline extensions—fiscal year to date is off 3.2% from the Proposed Budget projections. While capital gains are more critical to whether the budget revenues overall exceed or underperform the expectations, withholding reflects overall employment levels including bonus activity.
Even when combined with the lower projections in the Proposed Budget, this most recent cash flow report indicates revenues are dipping but still remain well above historical levels. The economy and its ability to generate revenues—especially the outsized revenues from the Bay Area and its tech industry—are slowing, but a deeper downturn is not yet indicated.
Recession Watch: Unemployment Insurance Claims
Using a four-week moving average, initial unemployment claims continue to trend higher in California than for the same period last year. California initial claims (not seasonally adjusted) at 21% of the national total for the four weeks ending April 15 continue to be well above the state’s overall share of the economy. Insured unemployment—a proxy for continuing claims—as of the week ending April 8 were 23% of the national total. This substantially higher reliance of the California labor force on benefits rather than earned income is another indicator of the labor supply constraints that have held the state’s recovery trend behind what has been seen in other states.

The state budget continues its failure to deal with the massive unemployment insurance fund debt run up during the state’s closure of jobs during the pandemic. As a result, the state fund remains wholly unprepared to weather a renewed economic downturn, if not risk sinking into an ongoing deficit if any recession exceeds current expectations for duration or severity. With almost all of the other states paying off their pandemic debt—including use of federal pandemic assistance funds specifically earmarked for this purpose—the remaining Federal Unemployment Insurance Fund debt essentially comes down to California and New York. At $19.1 billion as of April 17, California accounts for 70% of the total.

Recession Watch: WARN Act Layoffs
Under the federal and state Worker Adjustment and Retraining Notification (WARN) Acts, employers are required to submit notices of major layoff actions. This data is not necessarily complete and does not cover all separation actions. Individual company plans may also change during the time between the issuance of the notice and any final actions. The data, however, does provide a more current tracking of likely shifts in the trends for business activity including the location of any changes.
Using the most current data through the first half of April, the number of employees affected by these filings increased substantially in the first quarter compared to the prior year.

The Bay Area continues to lead in the number of employees affected, covering 40% of the total affected through April 14. As indicated previously, cutbacks in the Bay Area particularly within the tech industry have significant implications to both overall GDP growth for the state and state revenues given the overreliance of both on economic performance within this region.

CaliFormer Businesses
Additional CaliFormer companies identified since our last monthly report are shown below. The listed companies include those that have announced: (1) moving their headquarters or full operations out of state, (2) moving business units out of state (generally back office operations where the employees do not have to be in a more costly California location to do their jobs), (3) California companies that expanded out of state rather than locate those facilities here, and (4) companies turning to permanent telework options, leaving it to their employees to decide where to work and live. The list is not exhaustive but is drawn from a monthly search of sources in key cities.
Califormer Workers
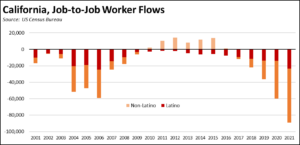
In addition to companies, an increasing number of workers are choosing to take jobs in other states as the costs of living grow in California. Using the Job-to-Job Flows data from US Census Bureau, California saw 258,000 workers taking jobs here while moving from other states in 2021, while the reverse flow saw 347,000 leaving, for a net loss of 89,000 workers. This loss was the highest since the beginning of the full year data series in 2001. Based on the first quarter results just released, 2022 is on track for another net loss of around 80,000.

The data does not cover all worker movement, but includes those moving from one job to another (defined as workers with no or only a small break between jobs). Other workers such as students getting their first job, persons re-entering the labor force, workers with a larger gap between jobs, and likely many teleworkers are generally not included in this series. In addition, data is incomplete in recent years for a few smaller states, but likely without a substantial effect on the final totals.
In 2021, the highest net loss (17.7% of net workers) was for persons taking jobs in middle-wage Retail Trade, followed by higher wage Professional, Scientific, & Technical Services (12.6%) and mixed wage Health Care & Social Assistance (11.6%). While the total net loss in 2022 was just under a half percent of total wage and salary jobs, the net outflow represents yet another and growing source of labor shortages, in this case experienced and trained workers.
There has been a net loss of Latino workers each year, although the share of Latinos has varied widely. In the latest full year for 2021, Latinos were 26.2% of the total net loss, rising to 30.5% in the first quarter of 2022.
Per Capita Disposable Personal Income Drops in 2022
Recent Bureau of Economic Analysis data indicates California saw the largest drop in per capita disposable personal income (current dollars) among the states in 2022, down 2.1%, although DC saw a somewhat larger decline at 3.2%. The US average was a loss of 0.5%. The comparable numbers for real personal income will be available later this year.
Disposable income is the amount left over for other household purposes after paying personal taxes, including income, property, and other miscellaneous taxes, licenses, and fees. Not included are payroll taxes for government social insurance, which are treated as contributions for future benefits. This indicator does include all sources of income, including capital gains and personal transfer payments such as the pandemic government payments and payments for other social benefit programs.
The decline experienced in 2022 was the largest since 1949.
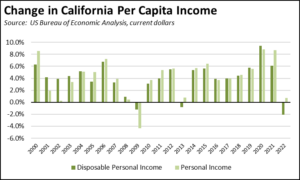
Disposable personal income dropped in 2022 due to a surge in personal tax receipts. Personal taxes consumed 18.3% of personal income in 2022, up from 14.5% in 2018 and from 10.5% in the previous low point in 2009.
But while California continues to burden personal incomes with growing taxes and fees, other states have sought to reverse the trend. According to the Tax Foundation, 22 states enacted or implemented personal income tax rate reductions in 2021 and 2022.

Union Share of California Workers Dips in 2022
In their annual analysis of the Current Population Survey, the unionstats.com results provide a more detailed breakdown of union membership data by state compared to the analysis available through US Bureau of Labor Statistics.
For California, union membership saw a brief uptick during the pandemic period to 16.2% in 2020 as the overall worker base dropped by nearly 3 million workers as the result of the state closure actions. In the latest 2022 results, the share of union members among all wage and salary workers dropped back to the 2019 level of 15.1%. The share of workers covered by union agreements was largely unchanged during the pandemic years, at 17.6% in 2022.

Union membership continues to rely heavily on public workers. Public worker membership in California dropped to 52.6% in 2022, also matching the pre-pandemic 2020 level but down from the previous high of 58.7% in 2012. The US number was 33.2% in 2022, continuing a steady decline since the prior peak in 1994.

In contrast, membership among private wage and salary workers remained in single digits, at 8.8% in 2022, also returning to the 2019 level and only a half percent above the lowest level in the series. The US number was 6.0% in 2022, the lowest level in the series.
