The Center for Jobs and the Economy has released our full analysis of the March Employment Report from the California Employment Development Department. For additional information and data about the California economy visit www.centerforjobs.org/ca
Highlights for policy makers:
- California Again Posts the Highest Unemployment Rate Among the States
- California Generates 21% of National Unemployment Insurance Claims
- Jobs Growth Still Tied to State Spending
California Again Posts the Highest Unemployment Rate Among the States
As discussed in our preliminary report last week, the March data again showed California with the highest unemployment rate among the states and DC and, at 5.3%, the highest in California since December 2021. In contrast, the current Department of Finance forecasts underlying the budget revenue and spending projections expected unemployment to be only 4.9% in the first quarter of 2024.
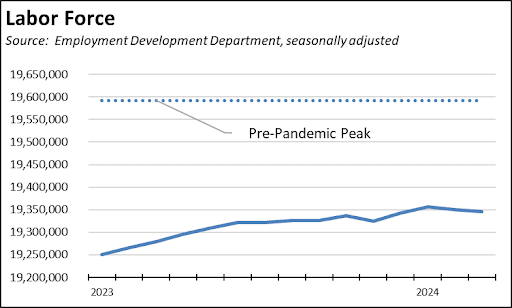
The labor force has seen modest growth, up 0.5% since the beginning of 2023, but overall remains well below recovery to its pre-pandemic high.
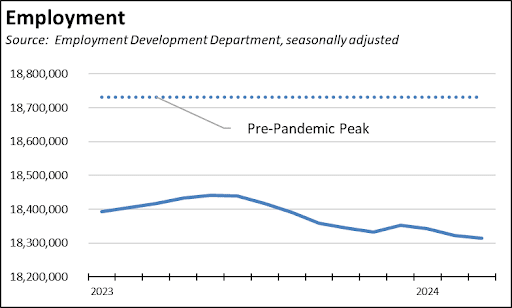
Employment in contrast has dropped 104,200 since last July, and is off 0.4% since the beginning of 2023.
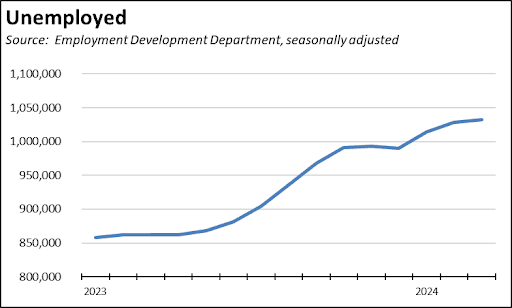
Underlying the rising unemployment rate, the number of unemployed has risen sharply, up 20.4% since the beginning of 2023.
While expanding labor supply normally would present the conditions necessary for future jobs growth, the employment numbers reflect the situation under which California employers have yet to show much movement in their hiring plans. In the most recent results through February, the number of unfilled job openings has roughly stabilized at an average of 800,000 over the past 4 months, or 0.8 job per unemployed. Looking at the other states as a whole, general labor shortage conditions still exist, with unfilled job openings at 1.5 jobs per unemployed.
California Generates 21% of National Unemployment Insurance Claims
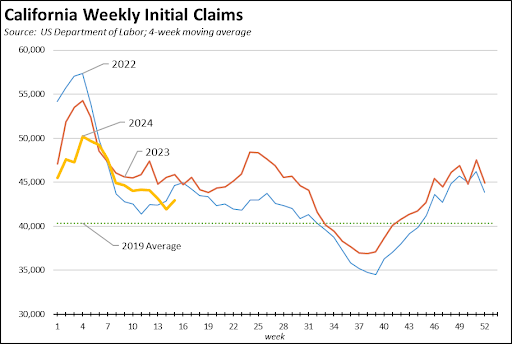
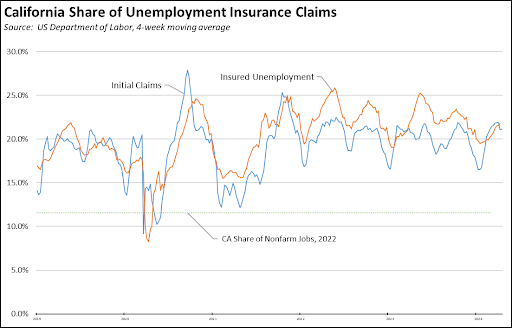
The current surge in the number of unemployed is reflected in the unemployment insurance claims data. Overall on a 4-week moving average basis, the number of initial claims has been tracking near the 2022 levels but somewhat below 2023.
The operation of the California program, however, has resulted in this state accounting for 21% of all initial claims nationally and 22% of insured unemployment (a proxy for continuing claims). To put these numbers in context, they are twice as large as California’s overall 11% share of wage and salary jobs and a third higher than the 16% share of total unemployed.
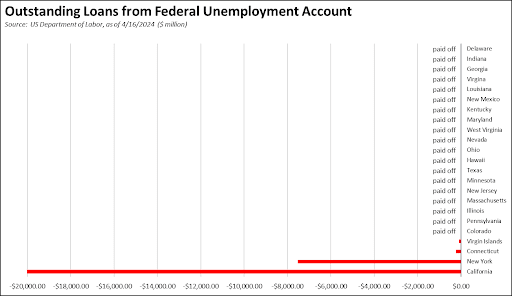
These unsustainable demands on state unemployment benefits have contributed further to the growing unemployment insurance fund debt that has been ignored to date in the state budget. Since the end of 2023, California’s debt has grown by another $0.9 billion (4.7%) and is now on track to exceed EDD’s latest projection of $20.8 billion by the end of 2024. And rather than pay down this debt, the recent early action budget package raided yet another tax on employment to backfill the general fund. This action reduced funds available under the Employment Training Tax at the same time the need is growing along with the surge in the number of unemployed.
The apparent policy decision to ignore this debt also flies in the face of the administration’s own projections. As indicated above, those projections already have failed to capture the current unemployment situation. Finance expected the unemployment rate in the first quarter to be 4.9% compared to the actual rate of 5.3% reported for February and March. Total number of employed was projected to be 931,000, or 9% below the actual result of 1,025,000. The Finance projections moreover also expect unemployment to continue growing through the second quarter of 2025, yet there are no actions proposed to improve the solvency of the fund that is supposed to address this growing caseload other than to divert even more funds away from other employment taxes that are supposed to serve the unemployed rather than the budget’s historically high spending plans on other programs.
Jobs Growth Still Tied to State Spending
As discussed in our prior reports, the cumulative effects of California’s high regulations, taxes, and fees on jobs has been masked by the state’s high tech growth center. Paying well above state average compensation and generating the bulk of state capital gains, this sector has made outsized contributions to state GDP, personal income, and state revenues. The current layoffs in this industry consequently have made the cumulative effects of state policies on the broader employment base more apparent.
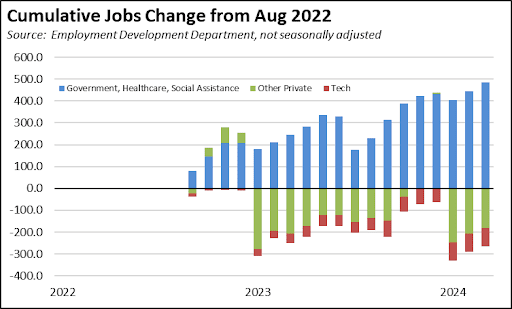
Using the Current Employment Statistics data for comparable categories where available under the Center’s definition of the industry, Tech employment peaked in August 2022 and was down 85,000 as of the March data, although significant additional layoffs were announced after the surveys used for that data were completed. As shown in the chart below, all of the state’s job growth since August 2022 instead has come from the industries largely dependent on public funding ranging from 100% in the case of government, to mostly all in the case of Social Assistance and its composition coming largely from In-Home Supportive Services (IHSS) workers, and a mix including the Medi-Cal and Obamacare driven growth in the case of Health Care. Even taking into account the seasonal patterns shown in the chart, other private industries in the state have experienced a jobs decline in this period.
Implications to the state budget come primarily from two points. First, windfall revenues from Tech enabled the state to expand spending to historically high levels which in turn underlay its primary sources of jobs growth. As Tech has retrenched, revenues have dropped and now raise challenges to continued jobs expansion particularly as that industry turns more to Artificial Intelligence and companies/company units with substantially lower employment levels than Tech previously saw in the expansion wave that has just ended. Second, state policies have left it with few alternatives. Jobs growth in other industries has stagnated or declined due to the cumulative effects of those policies.