The Center for Jobs and the Economy has released our initial analysis of the November Employment Report from the California Employment Development Department. For additional information and data about the California economy visit www.centerforjobs.org/ca. Due to the upcoming holidays, we will be publishing only the current report rather than our typical initial and full versions.
The November numbers once again showed mixed results. Combined with an upward revision to the October numbers, nonfarm jobs showed moderate growth with a gain of 20,200 over the two months. Employment in contrast showed a total loss of 24,200 in this period, and a combined loss of 101,100 since the near-term high in May 2023.
The surveys used to produce the monthly estimates, however, continue to face declining response rates, a factor partially contributing to the different economic picture being shown by the jobs and employment numbers. The establishment survey in particular is showing weakening response rates. While the initial read on the likely revisions to be published at the beginning of 2025 would be minor, the current projections based on the full job counts in the Quarterly Census of Employment & Wages (QCEW) now expect California’s nonfarm jobs to be lowered in the 150,000-170,000 range. An adjustment at this scale would slash jobs growth in the first half of the year from the currently estimated 222,000 to only 49,000.
The state’s substantially slower jobs performance is also reflected in its growing unemployment. The November unemployment rate of 5.4% while unchanged from October was also unchanged from being the 2nd highest among the states. The total number of unemployed also continued to grow, with unemployment now exceeding 1 million each month so far in 2024. While stabilizing, the jobs growth potential as indicated by unfilled job openings at the end of each month remains far below the level required to cut into the growing number of unemployed workers, with California by far the worst among the states at 1.7 unemployed workers vying for every job opening.
This week also saw the release of other key indicator data. California’s Real GDP in the 3rd Quarter grew at an annualized rate of 3.1%, matching the US average but ranking only 23rd among the states. Due to the state’s high tech component, the Personal Income results were somewhat better at 3.6%, above the US average of 3.2% and 13th highest among the states.
The population estimates from the Census Bureau showed California growing again, but at a substantially slow rate. Domestic migration still saw 239,600 more people leave the state than move here, but this outflow was matched by an uptick in international migration after the lower numbers in recent years. But while positive, population growth 2024 was low as both domestic and international migrants continue to seek better economic opportunities and lower costs of living in other states. If the states were to continue growing at their current rates, California would go from 52 House seats in the current Congress to around 48-49 in the next redistricting.
California Labor Force
Rate
California’s reported unemployment rate (seasonally adjusted) was unchanged at 5.4%. The US rate edged up 0.1 point to 4.2%.
Among the states, California again had the second highest unemployment rate, behind Nevada with 5.7%. DC also had a higher rate at 5.7%.
Employment fell 19,600 (seasonally adjusted), with the total employment loss since the previous peak in May 2023 at 101,100.
US employment fell by 355,000.
California unemployment continued rising by 9,400, while US unemployment also rose, by 161,000. California unemployment has been above 1 million every month to date in 2024, the highest levels since the pandemic period in 2021.
Participation Rate
California labor force (seasonally adjusted) fell 10,200, while the labor force participation rate was unchanged at 62.1%. The US labor force was down 193,000, while the participation rate notched down 0.1 point to 62.5%.
Recovery Progress: CA Employment vs. Other States
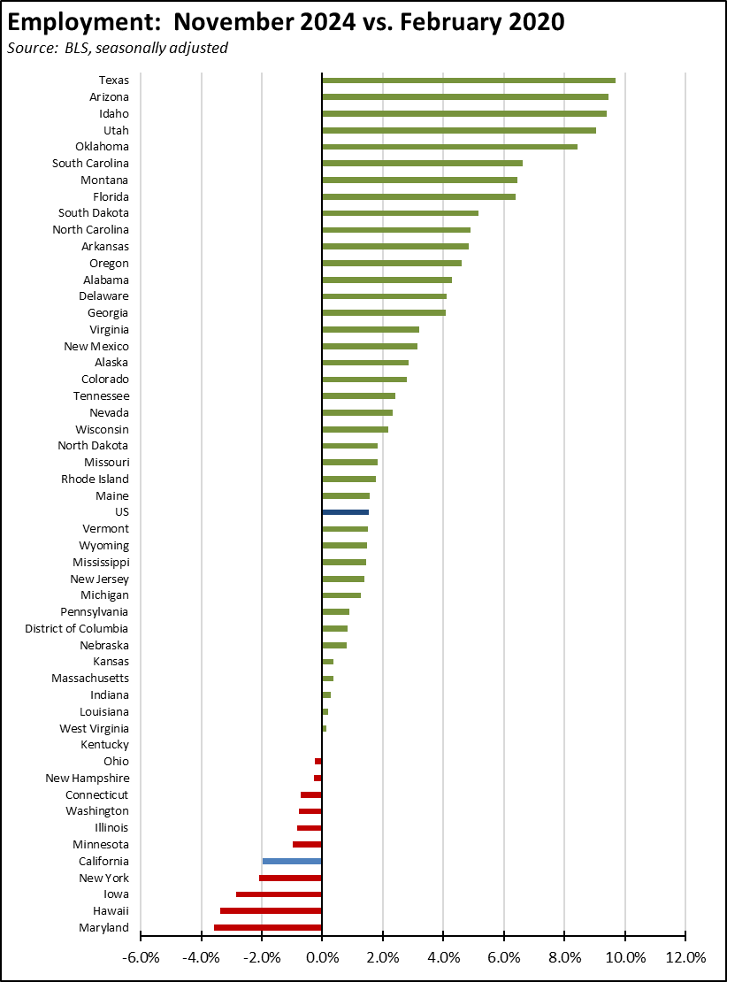
Compared to the pre-pandemic peak in February 2020, California’s relative ranking for employment recovery remained at 5th lowest among the states and DC.
Nonfarm Jobs
Change
Nonfarm wage and salary jobs rose 11,100 in the preliminary results for November, while the October losses were revised to a gain of 9,100.
For the US as a whole, nonfarm jobs rose 227,000 as some states recovered from the prior month losses due to strikes and hurricanes.
The seasonally adjusted numbers for California showed gains in 10 industries and losses in the other 8. Increases were led by Healthcare & Social Assistance (11,400), Administrative & Support & Waste Management & Remediation Services (2,300), and Wholesale Trade (2,300). Losses were led by Other Services (-3,300), Real Estate & Rental & Leasing (-3,200), and Construction (-2,800).
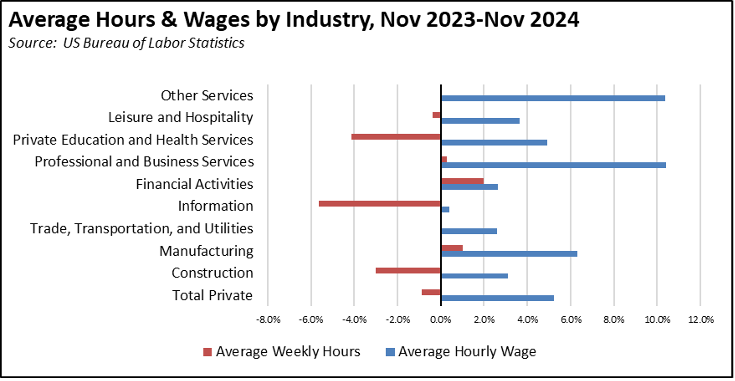
Hourly Wages Up 5.2%—Average Hours Edge Down
Over the 12 months ending November 2024, average hourly wage in all private industries saw growth of 5.2%. Only a portion of these gains were offset as average weekly hours worked edged down by only 0.9%.
The results, however, varied widely by industry. Professional & Business Services saw the highest wage gains at 10.4% along with Other Services also at 10.4%. Information saw the greatest hours contraction at -5.6%.
Recovery Progress: CA Nonfarm Jobs vs. Other States

Interactive Original: https://www.bls.gov/charts/state-employment-and-unemployment/change-in-nonfarm-employment-by-state-map.htm
California’s monthly job performance in November was the 5th highest among the states and DC. Jobs growth instead was led by Florida with 61,500, Washington with 30,900, and North Carolina with 15,000. Again, these rankings reflect in part recovery from the previous month’s losses due to strikes and hurricane closures.
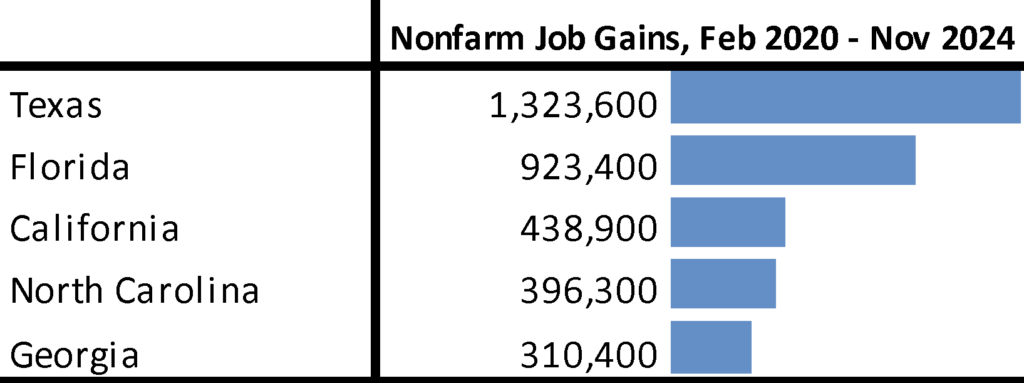
Compared to the pre-pandemic peak, California has now gained a net 438,900 nonfarm jobs, remaining in 3rd place just ahead of much smaller North Carolina.
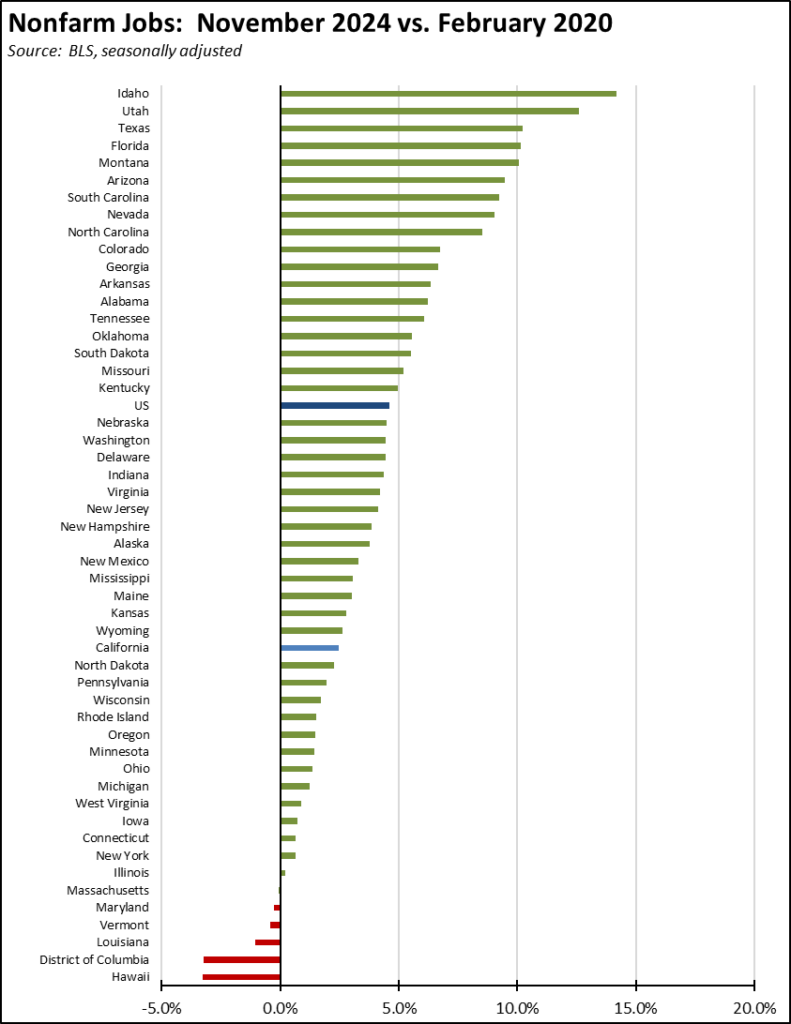
Adjusted for size, California notched down to 32nd highest, still below the US average. Only 5 states and DC remain below their pre-pandemic peaks.
QCEW Job Counts—2024 Q2 Results
As we have discussed in the past, the monthly job numbers issued by EDD and BLS are estimates based on surveys and modeling. The preliminary numbers released each month are then revised in the subsequent month’s release, and all numbers are further revised each year based on the actual job counts contained in the Quarterly Census of Employment & Wages (QCEW).
The Governor’s Office recently drew on the latest 2024 Q2 QCEW numbers to make the claim that California created more than 523,000 private sector jobs between January 2022 and June 2024. This result comes solely from cherry-picking the data and taking advantage of the fact that the QCEW data reports the raw numbers for each month and is not seasonally adjusted. The data for California in fact shows high seasonal variations, with January typically the low point for each year. For example, the January 2022 private jobs number reflects a drop of 206,761 in holiday hirings from December, quickly followed by a seasonal addition of 251,288 in February as employers resumed their annual cycles. Roughly half of the Governor’s number is simply one month’s worth of seasonal fluctuations.

In order to make accurate comparisons, analysts typically adjust how they treat unadjusted data like the QCEW through some means such as the seasonal adjustments applied in the monthly job numbers, a moving average, or by comparing the same period (month) in different years.
Using the last method, a different but far more accurate picture emerges from the data. Comparing each month to date in 2024 with the corresponding month in 2022, total private jobs have been slowing throughout 2024, and by June showed a growth of only 31,121 over the two-year period.
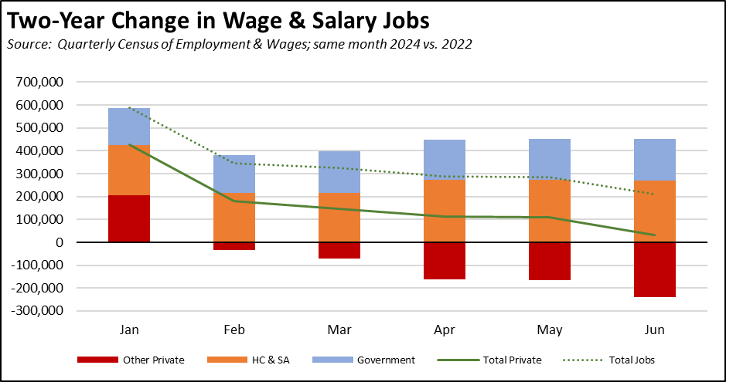
The composition of those private sector jobs is also significant. Healthcare & Social Assistance (NAICS 62)—largely as the result of government funding expansions—grew by 270,990 jobs as of June. Of these, 117,406 were in Individual & Family Services (NAICS 6241) largely composed of minimum wage, low hour In-Home Supportive Services workers paid through state Medi-Cal.
In contrast, jobs in all other private sector industries fell by 239,869.
The Governor’s release was correct in stating that “Private sector jobs are [the] backbone of California’s job growth,” but the reality is that those jobs have stalled and are now in decline. Job growth instead has been coming solely from expansion of government jobs and government supported jobs in Healthcare & Social Assistance. As the essential revenue base shrinks along with the private jobs base supporting it, even that growth comes into question.
The Governor has tacitly admitted this situation through the release of his latest jobs plan. A more direct version addressing more the state-imposed constraints to private sector jobs growth instead comes from his term as Lieutenant Governor, highlighting the need for more fundamental changes including:
- “Tackle the issues of cost and regulation by streamlining, simplifying, and aligning California’s policies to improve its reputation and business climate,” rather than the regulatory expansion that resulted by 2023 in a total of 420,434 restrictions in state regulations, compared to 296,926 in the next highest state (New Jersey) and an average of only 132,094 in all other states;
- expansion of manufacturing, rather than the increasing cost environment that has seen manufacturing jobs drop by 52,100 since their recent peak (seasonally adjusted) in July 2022.
- expansion of trade opportunities, rather than the current spate of state and local restrictions raising the cost and limiting the use of the state’s ports;
- “doubling down” on R&D, rather than last year’s action limiting the use of R&D credits and raising the cost of these activities in the state;
- “comprehensive federal and state tax reform that creates certainty for business and eliminates disincentives to domestic investment,” rather than recent actions that increased corporate income taxes by more than $6 billion, unemployment insurance taxes by more than $2 billion and growing over the coming years, and state payroll taxes by $5 billion.
QCEW Job Counts—Monthly Job Estimates Likely to Be Lowered
The full counts from the QCEW have become even more important as the response rates have fallen steeply in the surveys used to produce the monthly job and labor force estimates. As discussed in the past, the QCEW results and their likely effect on the annual revisions for each state are now tracked regularly by the Federal Reserve Bank of Philadelphia.
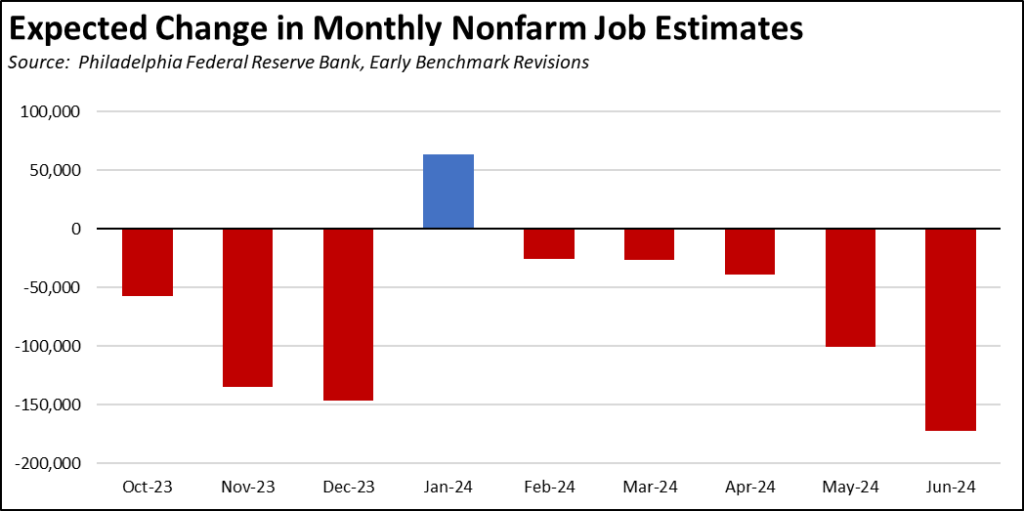
Factoring in the 2024 Q2 results, these early benchmark numbers based on the QCEW indicate that instead of growing by 79,800 (seasonally adjusted) between January and June, nonfarm jobs contracted by 156,400. Expected changes in nonfarm numbers for the early benchmark period are shown in the chart. Note that this number is substantially more than the preliminary revision expectations announced by US Bureau of Labor Statistics for March. Divergence between the monthly modeled estimates and the QCEW counts has grown since then.
Nonfarm Jobs by Region
By region, job gains were concentrated in the Inland Empire, Bay Area, and Orange County. Compared to pre-pandemic levels, the interior regions and San Diego/imperial continued to show the strongest gains, while the Bay Area continued to post the largest shortfall.
Because the data in the table is seasonally adjusted, the numbers should be considered as the total for the counties in each region rather than the regional number. This job series also is not available for all areas in California.
Unemployment Rates by Region
Looking at employment change over the year, the Central Valley showed the strongest gains, followed by Los Angeles moving into the plus column. Compared to the pre-pandemic period, the strongest shortfalls remain in Los Angeles and the Bay Area.
Unemployment rates (not seasonally adjusted) remain higher in most regions compared to pre-pandemic February 2020 levels.
Counties with Double-Digit Unemployment
Unemployment Above
10%
The number of counties with an unemployment rate (not seasonally adjusted) at 10% or more edged up to 3. The unadjusted rates ranged from 3.5% in San Mateo to 19.0% in Imperial.
Unemployment Rate by Legislative District
The estimated unemployment rates (not seasonally adjusted) are shown below for the highest and lowest districts. The full data and methodology are available on the Center’s website.
Unfilled Job Openings Level Off
With the September sharp drop revised upward, California unfilled job openings have essentially leveled off, showing little change over the past 5 months from the average of 624,000. The October number came in at 626,000.
These results, however, also indicate that the state’s unmet job growth potential has also stalled. Comparing the job opening rates (job openings as a share of job openings plus total employment), California’s performance at 3.3% remains well below the national average of 4.6%.
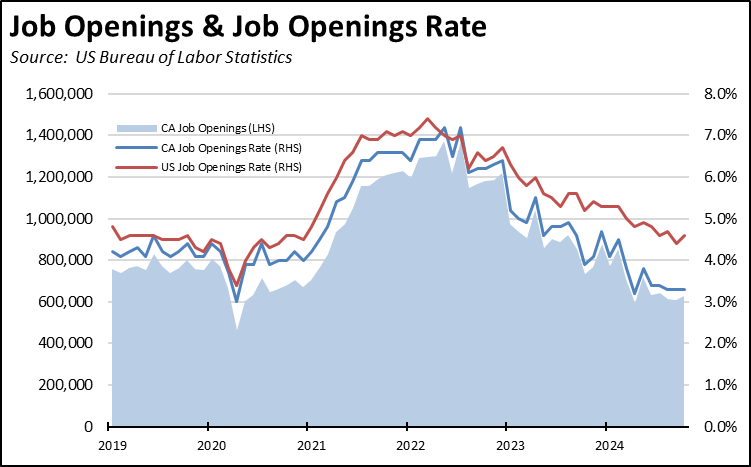
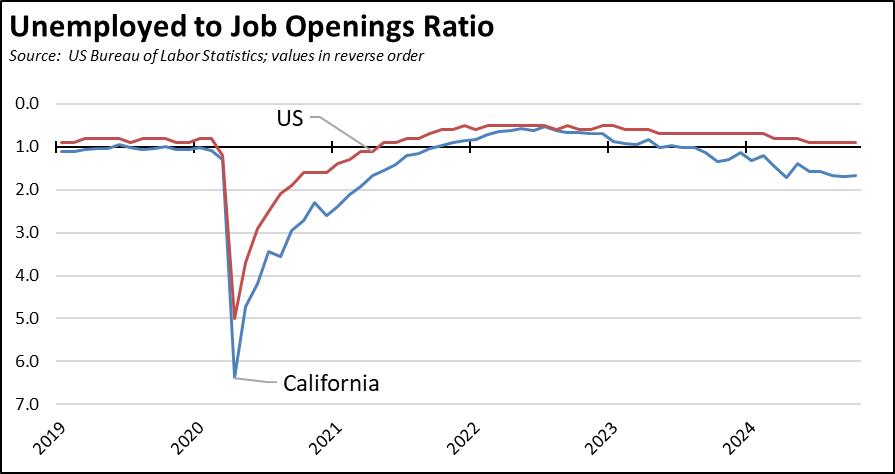
California’s high unemployment numbers combined with relatively low job openings puts the state at 1.7 unemployed for every available job opening. The US overall remains just within labor shortage conditions with 0.9 unemployed per job opening. California has been the worst state as measured by this metric since September 2023, and currently is well above the next two worst states (Washington and Illinois) reporting only 1.3 unemployed per job opening. California’s unemployment is growing, and the state does not have a sufficient level of jobs in the pipeline to bring it down.
CaliFormer Businesses
Additional CaliFormer companies identified since our last report are shown below. The listed companies include those that have announced: (1) moving their headquarters or full operations out of state, (2) moving business units out of state (generally back office operations where the employees do not have to be in a more costly California location to do their jobs), (3) California companies that expanding out of state rather than locate those facilities here, and (4) companies turning to permanent telework options, leaving it to their employees to decide where to work and live. The list is not exhaustive but is drawn from a monthly search of sources in key cities.
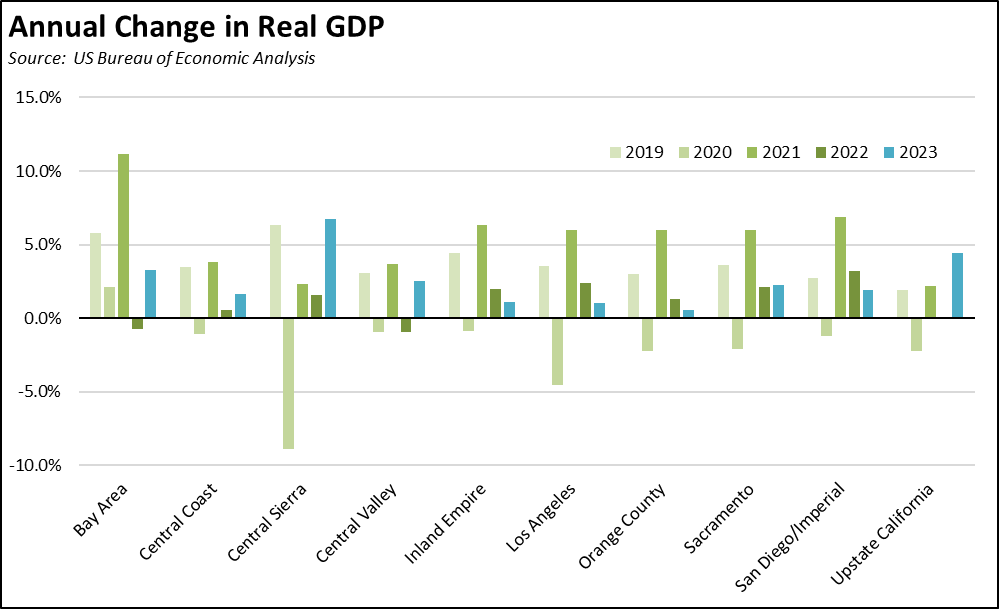
County GDP Growth Rebounds in 2023 but at Subdued Levels
Real GDP growth in 2023 showed expansion from the 2022 levels in 6 out of the 10 regions. Growth was strongest in the smaller primarily rural regions, while the Bay Area—the dominant factor in the state’s overall GDP growth and its budget condition—grew by only 3.3%. Among the other larger urban areas, Los Angeles was far weaker at 1.0%, with San Diego/Imperial at 1.9%, Inland Empire at 1.1%, Orange County at only 0.5%, Sacramento at 2.2%, and Central Valley at 2.5%. Note that Real GDP is calculated separately for each county. The numbers in the chart reflect aggregations for the constituent counties rather than separate estimates for each region.
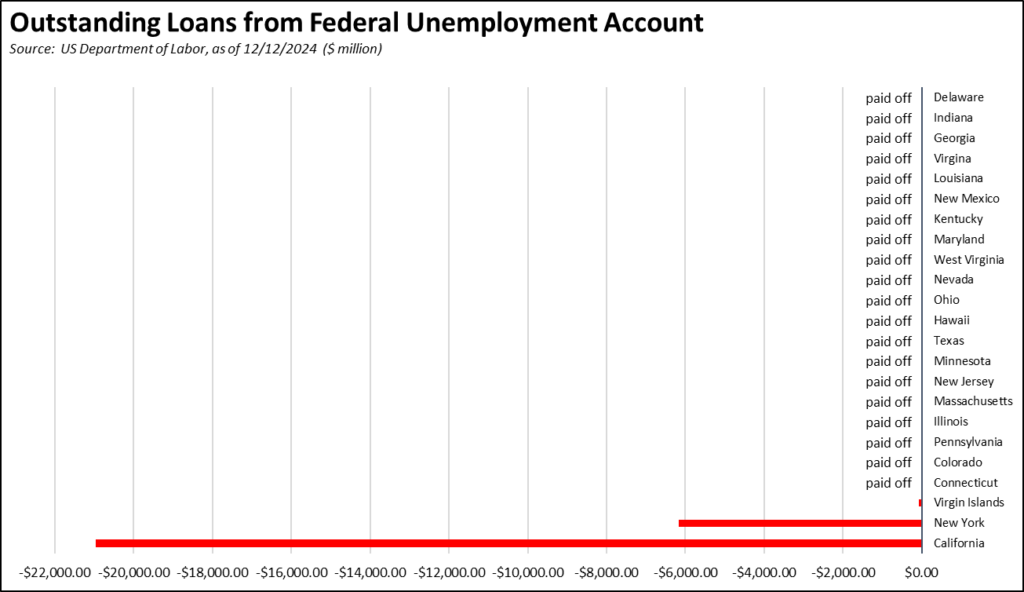
State UI Fund Debt Nears $21 Billion
The state’s continuing failure to address its burgeoning Unemployment Insurance debt saw the level near $21 billion. Current projections remain unknown as EDD has yet to release their October 2024 Unemployment Fund Forecast.
All other states other than New York have paid off their pandemic period debt, in large part using the federal funds provided for that purpose. California instead chose to use those funds on other expenditures.
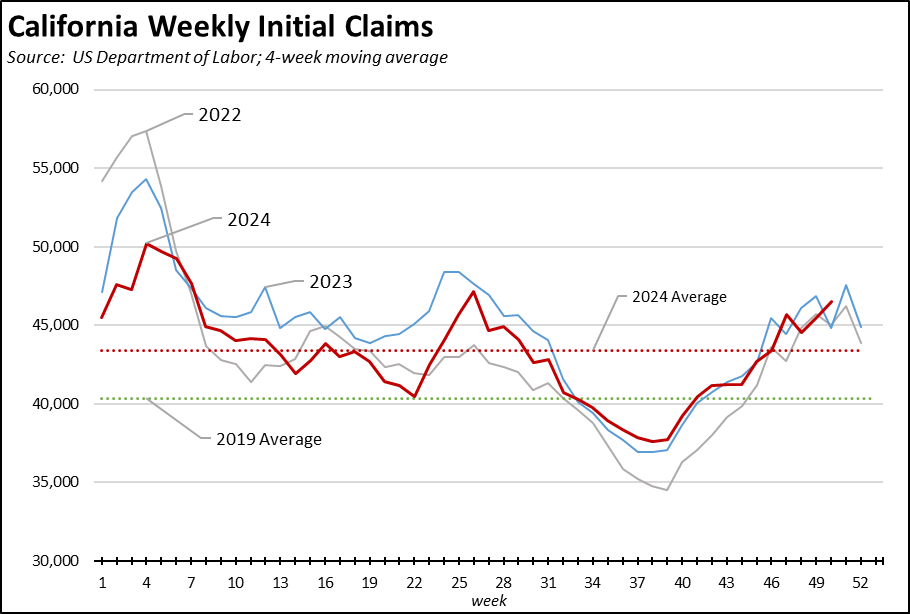
Measured on a 4-week moving average basis, the number of initial claims continues to rise but largely in tune with the trend from 2023.
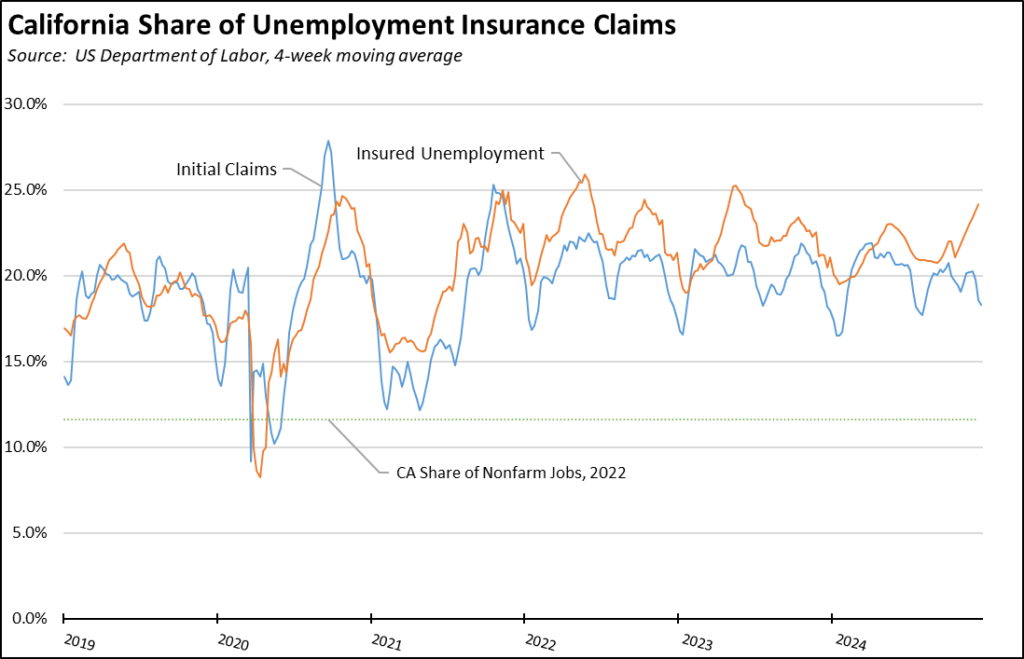
The number of workers receiving unemployment—as measured by insured unemployed (a proxy for continuing claims)—is now tracking somewhat above the 2023 levels, and also remains substantially above the levels in 2022.

A recent report by Legislative Analysts’ Office brings a needed focus to the fact that the state’s critical unemployment insurance program is functionally bankrupt. That report, however, focuses on the revenue side of the program. Missing from the analysis is the degree to which costs have driven the finances to the point that recovery is now questionable. The administration of the program has resulted in one of the most generous payout levels in the nation. While some of this situation is due to the state’s higher unemployment levels, a significant portion also relates to differences in how benefits are assessed and issued. While California contains 11.8% of all wage and salary jobs (2023), insured unemployment covered 24.2% of the national total in the latest results (4 week moving average), while initial claims were at 18.3%. In the latest 2023 data from US Bureau of Economic Analysis, 19.6% of all state unemployment insurance compensation nationwide was paid out by the California program.
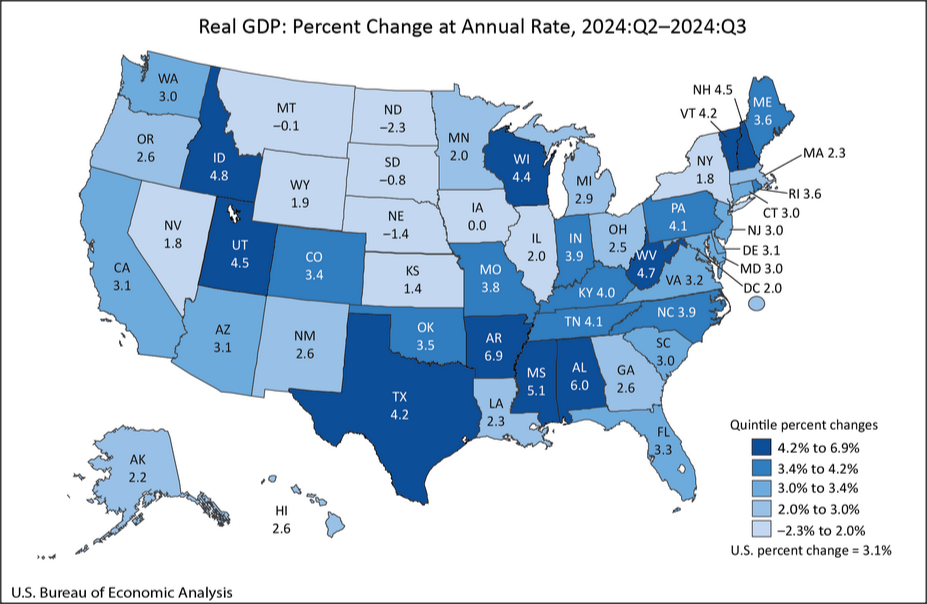
California Real GDP Grows 3.1% in the 3rd Quarter
US Bureau of Economic Analysis data shows California’s real GDP grew at an annualized rate of 3.1% in the 3rd Quarter, the 23rd highest among the states but matching the overall national average of 3.1%. This performance was higher than the 2.8% from the 2nd, but down from 6.3% in the 1st Quarter. Over the year (2023 Q3 to 2024 Q3), California grew 3.6%, the 9th highest among the states.
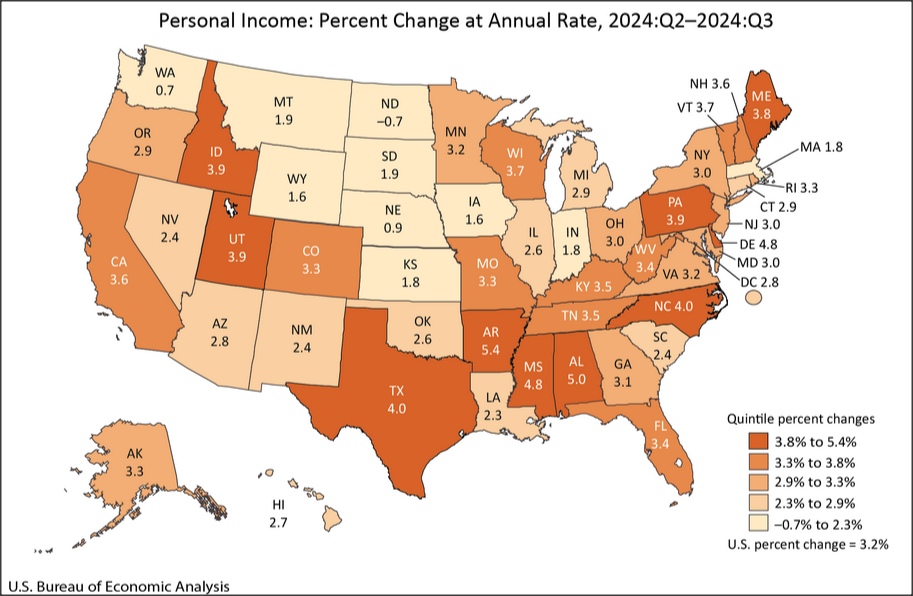
California Personal Income Grows 3.6% in the 3rd Quarter
US Bureau of Economic Analysis data shows California’s Personal income grew at an annualized rate of 3.6% in the 3rd Quarter, the 13th highest among the states and above the overall national average of 3.2%. California’s rate moderated substantially from 4.2% in the 2nd Quarter and 14.7% in the 1st Quarter. Over the year (2023 Q3 to 2024 Q3), California grew 6.3%, the 3rd highest among the states.
California Grows 0.6% in 2024
The US Census Bureau’s population estimates show California growing by 232,600 (0.6%) in 2024, up from 0.1% in 2023. Total estimated population is 39,431,000. About half the gain came from natural changes (births over deaths), while the remainder came from a recovery in international migration.
California continued to show a net outflow from domestic migration, with 239,600 more people leaving the state than moving here. This level was down somewhat from the 2023 outflow of 344,000.

California’s population growth, however, is slowly substantially as both the resident population and foreign immigrants look for better economic opportunities and lower costs of living in other states. If California continued growing at the 2024 rate, the number of Congressional seats would drop from 52 in the current Congress to around 49 in the next redistricting. If instead it grew at the somewhat slower rate between 2019 and 2024, the number of seats would drop to around 48.
