The Center for Jobs and the Economy has released our full analysis of the November Employment Report from the California Employment Development Department. For additional information and data about the California economy visit www.centerforjobs.org/ca.
Highlights for policy makers:
- Budget Economic Projections: US Up, California Down
- Unemployment Remains Above 1 Million
- Counties with Double-Digit Unemployment
- Unemployment Rate by Legislative District
- Youth Employment Continues to Erode
- Unemployment Insurance
- CaliFormers: Updated Moves
Budget Economic Projections: US Up, California Down
While the budget surplus/deficit outcome is determined largely by stock market performance and capital gains, the core budget revenues including corporation income tax, sales and use tax, and fees are tied more to the state’s economic performance. Department of Finance consequently updates economic projections prior to the Proposed Budget and May Revise.
In the case of the US, the Finance numbers expect higher growth compared to last year’s May Revise. Projected jobs are higher, unemployment rate largely stable rather than expanding, and real GDP rising by about 2% annually, largely in line with other projections although more current indicators are suggesting higher growth in 2025:Q2 and 2026:Q1.
The California numbers are lower. The all budget-important personal income numbers still show about 1% real growth in 2026 and slightly higher in 2027, but the absolute estimates are little changed from the May Revise. Nonfarm jobs and unemployment shift from marginal improvement to a continuation of the stagnation the state has seen in the past two years with nonfarm jobs showing a small decline.
In both cases, the inflation prognosis shows improvement, due to a strong contribution from dropping world oil prices. California’s cost of living is still expected to rise faster than for the US as a whole.
The composition of the job projections also points to the growing weakness of the state economy and its growing dependence on government spending at the expense of growing jobs in other sectors. As we have tracked in our monthly reports, jobs in the forecast window are sustained even at stagnant levels only through government spending on healthcare, social services, and government itself. The other private industries across the board are expected to show only marginal change or continue to shrink while growing in other states. In total, government, health care, and social services are expected to expand—along with the public revenues needed to support them—by 467,000. All other private industries combined show a further net contraction of 117,000.

The current tendency to focus on tax hikes to maintain and in some cases expand state expenditures misses the economic point entirely. Core private sector industries are already contracting under the onslaught of California’s regulations, taxes and fees, and costs of doing business and for their employees, costs of living. The disturbing trends in Finance’s numbers strongly suggest greater attention instead needs to be paid on what reforms are needed to keep and expand a more sustainable jobs base.
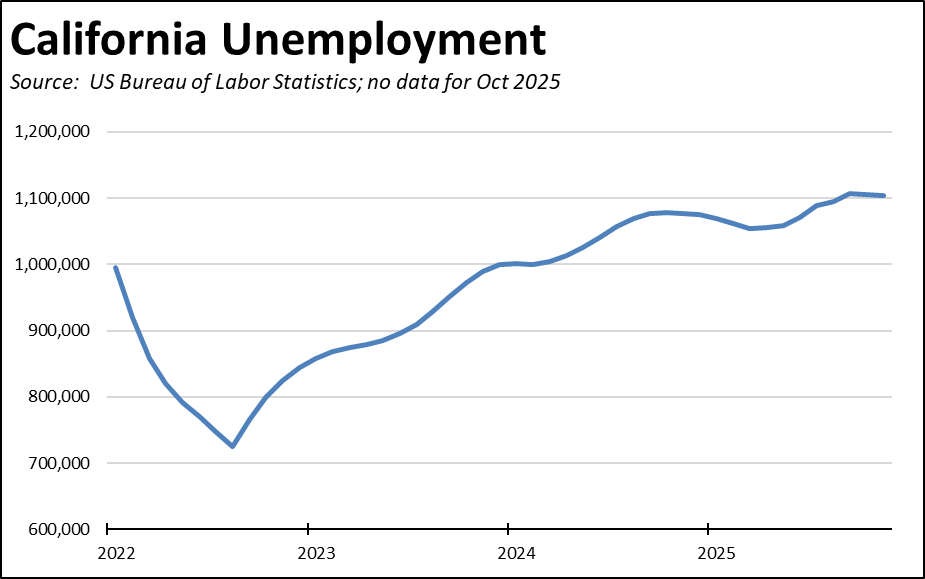
Unemployment Remains Above 1 Million
With the state once again posting the highest unemployment rate among the states at 5.5% (seasonally adjusted) in November, total unemployment has remained above 1 million since January 2024. The November unemployment level is 31% higher than in December 2018.
Unemployment rates (not seasonally adjusted) were higher in all regions compared to pre-pandemic February 2020 levels other than the Central Coast, Upstate California, and Central Valley. All regions other than Orange Country posted rates that were higher the overall unadjusted rate of 4.2% for all the other states.
Counties with Double-Digit Unemployment
The number of counties with an unemployment rate (not seasonally adjusted) at 10% or higher notched up to 3. The unadjusted rates ranged from 3.8% in San Mateo to 20.0% in Imperial. In the chart, counties with unemployment rates higher than the state average are coded in red.

Unemployment Rate by Legislative District
The estimated unemployment rates (not seasonally adjusted) are shown below for the highest and lowest districts. The full data and methodology are available on the Center’s website.
Youth Employment Continues to Erode
As we have discussed in the past, one of the most effective tools to combat income inequality is early employment opportunities for youths. The early development of workplace skills has been consistently shown in the literature to lead to higher lifetime wages and earnings.
California is closing this window of opportunity. As shown in the chart below, youth employment (age 14-18) has generally been in decline since the first part of the century, but primarily due to economic cycles. Youths experienced more significant cuts during the Great Recession, and after a gradual recovery trend again saw a steep drop during the pandemic. They then along with other job seekers experienced a surge during the labor shortage period immediately following the state’s reopening. Following enactment of AB 1228 increasing the fast food minimum wage to $20 an hour, jobs for this age group again have gone into a steep decline. Compared to the peak in 2023, jobs for this age group are down by just over one-fifth.

This trend is also reflected in the unemployment rates for this age group. Using a 12-month average from the Current Population Survey microdata (October survey was not conducted due to the federal closures), Youth unemployment is running about 5 times higher than the overall California average.
Unemployment Insurance
California employers—both private and government—previously faced the possibility that the federal employment tax rate—which comes on top of the state tax—would jump from its 2025 level of 1.5% to 5.2%. This potential increase stemmed from the initial determination that the state was subject to the “Benefit Cost Rate (BCR) Reduction” due to its persistent failure to pay off its substantial and growing unemployment insurance fund debt. The Department of Labor, however, subsequently approved the state’s waiver request. As a result, the federal tax rate increased to 2.1% in 2026 compared to 0.6% in the other states. In total, EDD expects that California employers will pay an additional $1.6 billion in federal taxes for 2026, rising to $2.0 billion in 2027.
With New York paying off its substantial debt this summer, California is now the only state carrying a debt from the pandemic period. Almost all the other states instead paid off their debts using federal assistance funds allowing for this specific use. While other states have restored the health of their funds, California’s debt in sharp contrast has continued to grow by $2.0 billion since the end of 2021. EDD’s latest projections expect the debt to grow even further by another $0.5 billion in 2026. The state budget is also affected due to the substantial interest payments, pegged by the governor’s Proposed Budget at $622 million in 2026.

Current UI claims show little prospect for change. Reflecting the extent to which the California jobs situation has remained stagnant and unemployment high over the past two years, initial claims continue to largely track the 2024 and 2025 trends.

Insured unemployment, a proxy for continuing claims, ended 2025 trending slightly below the previous years.

Reliance of California workers remains substantially higher than in the other states, with initial claims running at about 20% of the national total compared to the state’s 11% share of total wage and salary workers.

CaliFormers: Updated Moves
Additional CaliFormer companies identified since our last report are shown below. The listed companies include those that have announced: (1) moving their headquarters or full operations out of state, (2) moving business units out of state (generally back office operations where the employees do not have to be in a more costly California location to do their jobs), (3) California companies that expanding out of state rather than locate those facilities here, and (4) companies turning to permanent telework options, leaving it to their employees to decide where to work and live. The list is not exhaustive but is drawn from a monthly search of sources in key cities.