The Center for Jobs and the Economy has released our full analysis of the October Employment Report from the California Employment Development Department. For additional information and data about the California economy visit www.centerforjobs.org/ca.
Highlights for policy makers:
- Key Takeaways
- Economic Trends & the State Budget: The Costs of Relying on One Small Basket for All the Eggs
- Unemployment Claims Rise in Line with Seasonal Pattern but Remain Well Above National Averages
- Califormer Businesses
Key Takeaways
- As a result of twice extending the 2022 tax filing date for most of California, the state’s revenue picture remains unclear. Daily tracking by the State Controller, however, indicates that the crucial personal income tax revenues are coming in below budget projections.
- In general, most overall economic indicators are tracking close to the projections underlying the current budget bill. The more economic-sensitive sales and use taxes are slightly above projections through the end of October. Total personal income is only 0.6% lower than expectations in the most recent data from the second quarter. Employment, however, has fallen in the past four months.
- The totals, however, are less relevant as the budget’s health has become heavily dependent on only a portion of the taxpaying base, both by income and geographically. In the latest data from 2021, only 8,519 taxpayers paid a quarter of all personal income tax. Over 40% of personal income tax paid by state residents comes from the Bay Area, making the state budget highly vulnerable to fluctuations in this region’s economy, particularly the tech industry.
- Persistent high unemployment claims contribute to a substantial federal unemployment fund debt that is projected to worsen, with California’s program covering a significantly larger labor force compared to other states.
Economic Trends & the State Budget: The Costs of Relying on One Small Basket for All the Eggs
As discussed in last month’s report, the state in recent years has been experiencing an unprecedented rise in general and special fund revenues, exceeded only by an even greater rise in expenditures that are on course to produce deficit spending in the current and following three budget years even under the current high revenue expectations. Weakening of state revenues is likely to make this self-inflicted situation somewhat worse, but the extent of which is still unknown. The due date for 2022 income tax returns and payments (personal and corporation) previously was extended to October 16 for much of the state and then later extended again to November 16. These delays in the primary components of total state revenues are leading to delays in the normal budget forecast process, including last week’s announcement from LAO that their first-out-of-the-box revenue outlook was being pushed off from early November to December.
Initial indications, however, are that revenues are falling short of the current budget bill projections.
The Personal Income Tax Daily Revenue Tracker maintained by the State Controller shows this crucial component of revenues falling short of the expected goal. The current budget bill is based on personal income tax revenues totaling $66.0 billion by the end of November. As of November 17—one day after the revised 2022 filing deadline—only $43.7 billion had come into the state. These are only preliminary numbers and will be revised as the final accounting is done. Also not yet included are the monthly amounts for withholding—which has been running at around $7 billion—and estimated payments. The final November take will be higher, but there is substantial ground to cover before reaching the level required to support the expenditures approved in the budget let alone other expenses that should have been incorporated but instead ignored such as the health workers minimum wage hike which is now estimated to cost the state at least an additional $4 billion ($2 billion general fund).
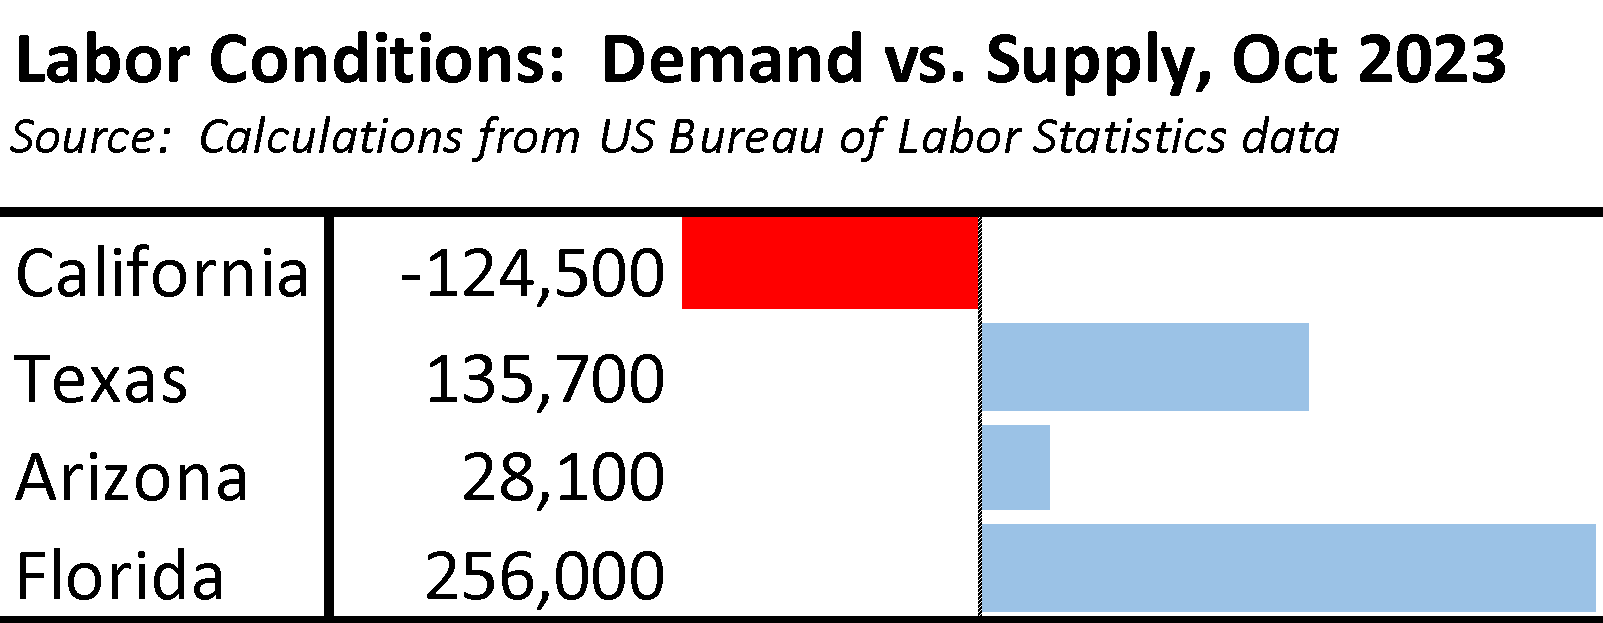
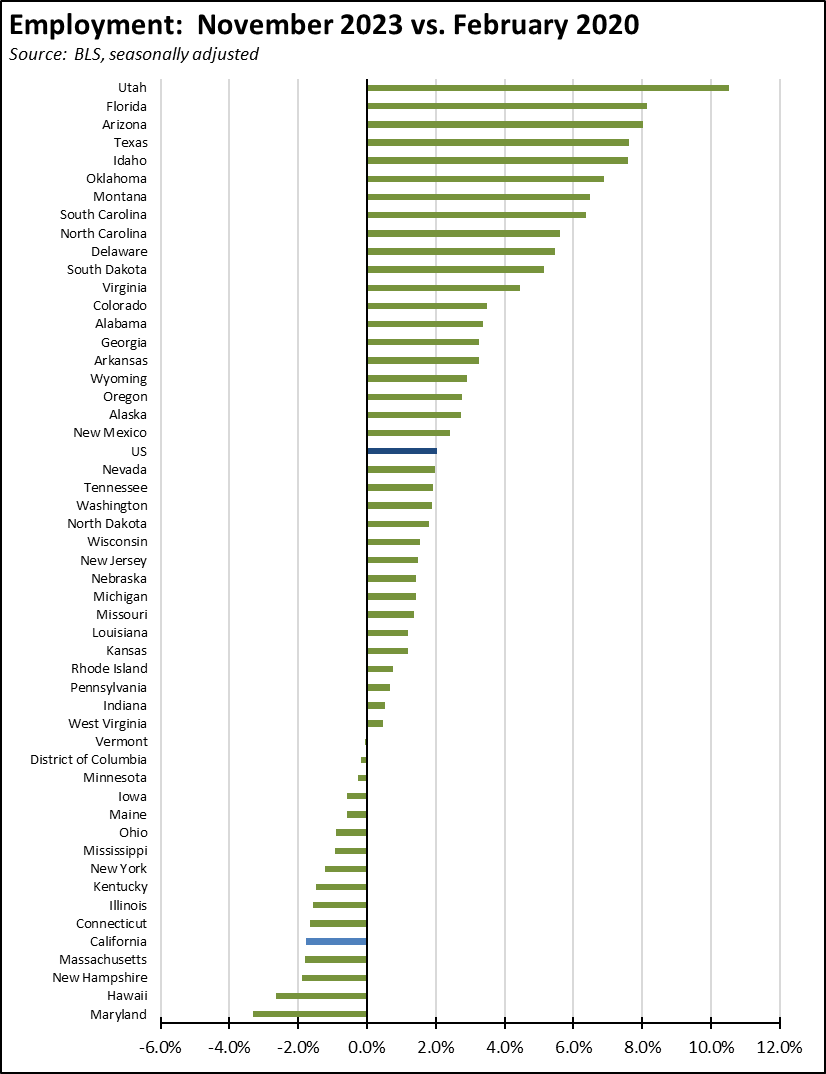
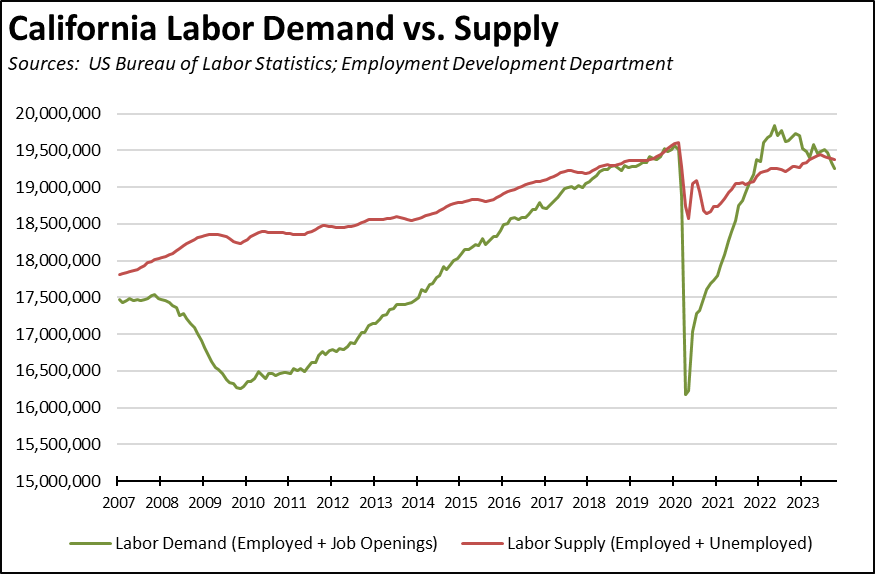
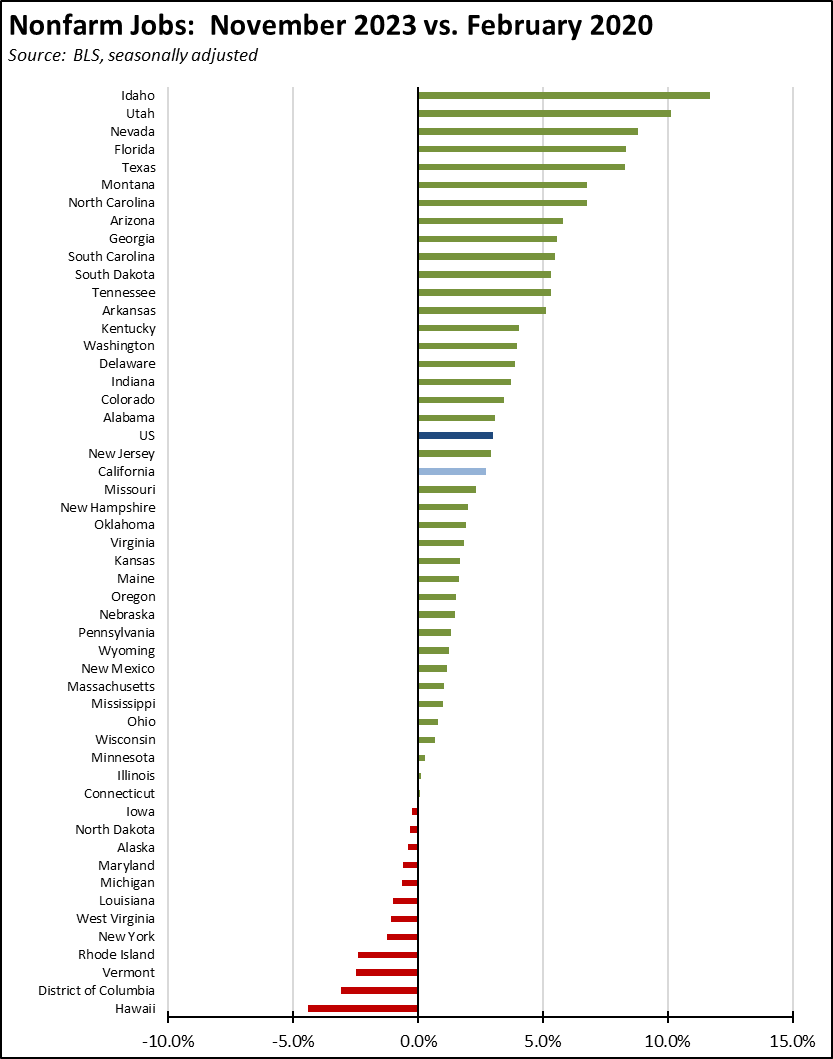
In other revenue indicators, there is little sign yet that overall economic activity is falling below expectations. In the preliminary October year-to-date totals from the State Controller, sales and use taxes—a revenue source that better reflects general economic levels—was up marginally at 4.6% higher than the budget bill projections. Total state personal income also has been tracking closely with the Department of Finance projections, at only 0.4% lower than forecast in the recently released revisions for 2022 from US Bureau of Economic Analysis and 0.6% lower in the recent results for 2023 Q2. Employment in contrast has been running lower than projections, with the numbers showing a decline over the past 4 months.
But the nature of the state’s revenue model makes the totals largely irrelevant. What instead matters more is the distribution of income, both by income level and geographically.
By income, as the state’s tax system has increased its dependence on high earners, the health of the general fund has relied on the personal outcomes for an astonishingly small portion of total taxpayers. In the recent results reported by Franchise Tax Board for tax year 2021:
- High income earners—defined by Internal Revenue Service as taxpayers with adjusted gross income (AGI) of $200,000 or more—comprised only 9.8% of all tax returns but paid 81.1% of the total tax. As working from home has taken root especially in higher income industries and professions, this core of the tax base has become increasingly more mobile.
- High earners with AGI of $1 million or more filed only 0.9% of all tax returns but paid nearly half (49.2%) of the total tax.
- High earners with AGI of $10 million or more covered only 8,519 (0.05%) returns, but paid just under a quarter (24.4%) of the total tax.
The extent to which the budget remains in surplus or quickly slips into deficit consequently is dependent on the earnings and residency decisions of only a relatively few of those forming the core taxpaying base for the state.
Geographically, the state budget is also overly dependent on the economic outcomes of a single region and to a large extent a single industry. In the 2021 results, the Bay Area which has just over 19% of total state population produced just under half (45.2%) of all personal income tax paid by state residents, and 40.5% when nonresident payments are included in the total as well.
As shown in the chart below, outsized personal income growth in the Bay Area has been the prime base of support for the state budget. Personal income in the rest of the state largely caught up only as a result of the temporary pandemic era assistance payments, and the Bay Area upsurge in 2021 led to the comparable rise in overall state revenue results. The 2022 income base from which the tax results have been filtering into the state’s coffers shows a reversal. Personal income rose only marginally (0.2%) in the rest of the state, but fell 1.3% in the revenue critical Bay Area.
The outsized importance of Bay Area income masks other indicators as well. For example, personal income tax withholding has been tracking close to the budget bill projections, but only because of the recent recovery in tech industry stock values. Tax withholding on equity compensation—payments such as stock options—has become a larger portion of overall withholding, now at more than 6% of the total in recent years. Because the withholding amount depends on the underlying stock value, LAO estimates that total withholding would be down 1% compared to the prior year without the recent tech company stock price gains, rather than being up 1% as they currently are.
The economic contributions from a single region and within that region the fortunes of the singular tech industry largely built in the absence of regulation have enabled the state to keep up the appearances behind its perennial claim that its high regulation/high tax model is a success. After becoming overly reliant on a single basket and only a few taxpaying eggs in the process, the state budget model is poised to test the reality of those claims.
Unemployment Claims Rise in Line with Seasonal Pattern but Remain Well Above National Averages
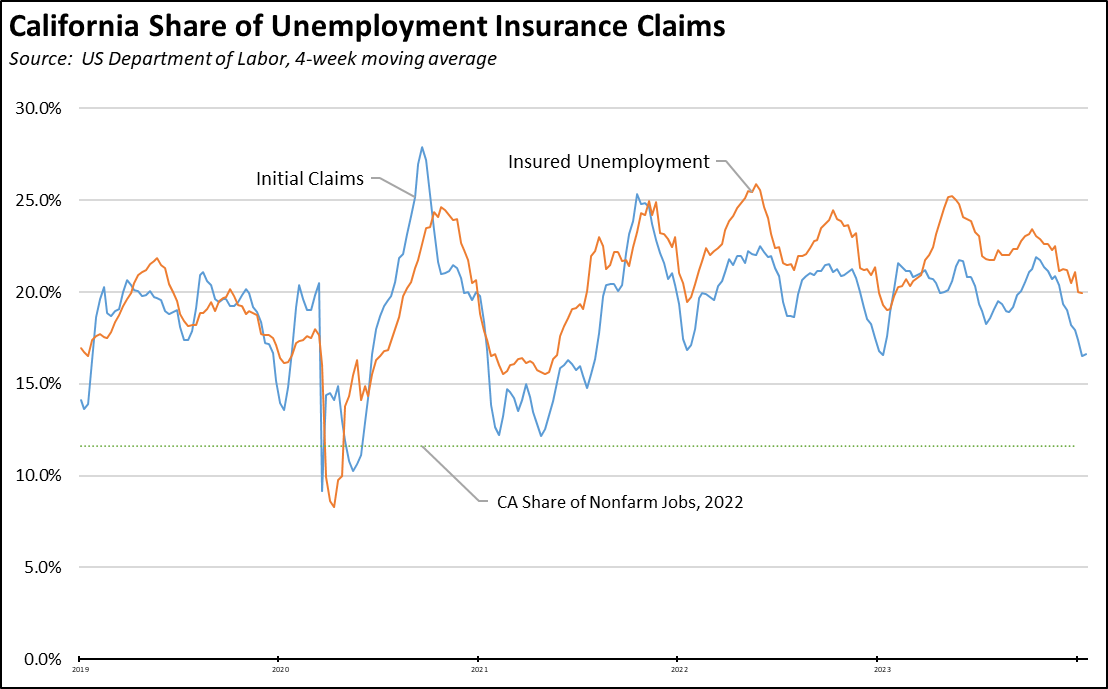
The rise in initial claims (4-week moving average) moved closer to the pattern seen during the same period in 2022. While claims are up, they reflect seasonal patterns rather than any cyclical indication.
Insured unemployment—a proxy for continuing claims—remains strongly elevated over the 2022 numbers. These numbers again reflect the outcome of state policies advancing benefit payments rather than earned income opportunities.
The California program also continues to cover a substantially higher portion of the labor force than in other states. In the latest results (4-week moving averages), California produced 20.8% of all initial claims and 22.6% of insured unemployment. In contrast, California contains only 11.6% of all nonfarm jobs.
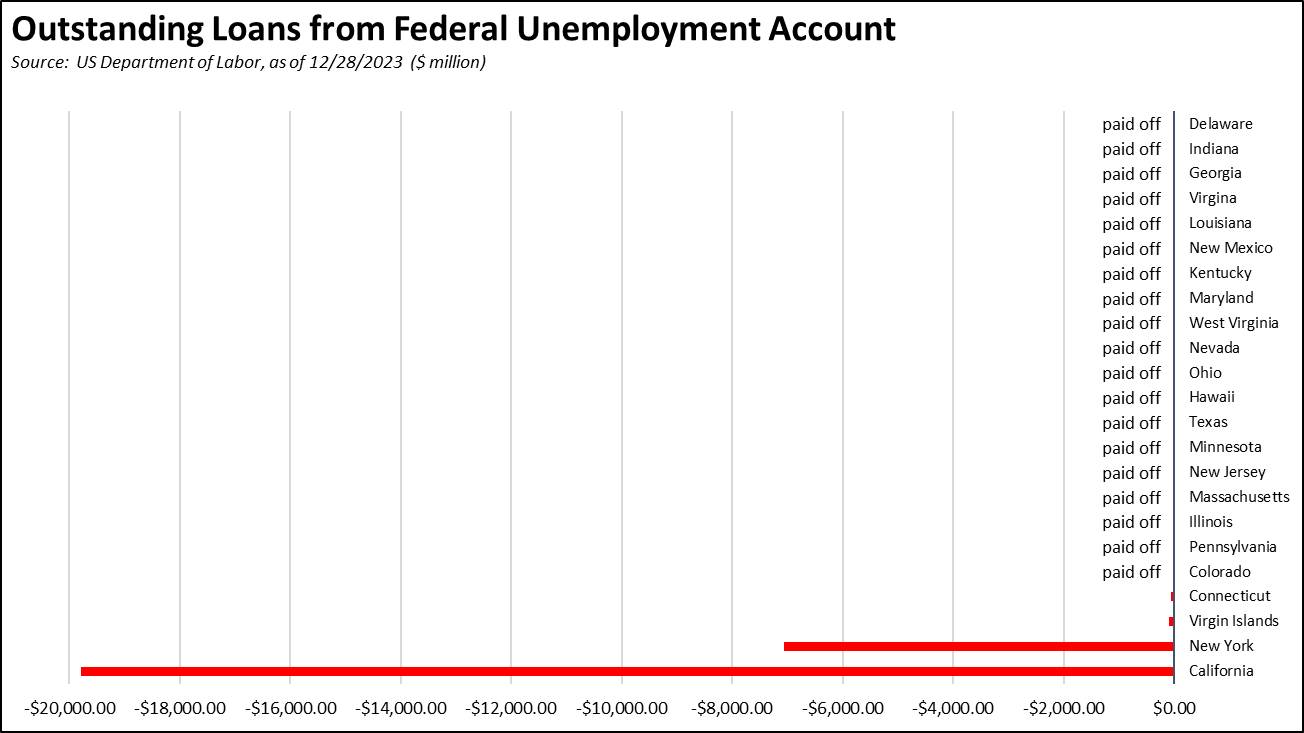
California’s federal unemployment fund debt again accounted for 73% of all monies owed by the states, rising to $19.1 billion as of November 16. The total debt remains on track to match EDD’s most recent fund forecasts which anticipate further deterioration in the fund’s conditions even in the absence of another economic downturn. Fund debt is expected to reach $19.7 billion by the end of 2023 and $20.3 billion by the end of 2024. With the exception of New York, all other states that fell into debt during the pandemic have paid off the balance and in many cases restored their state funds to pre-pandemic levels as well, applying federal pandemic funds specifically allowed for this purpose.
Califormer Businesses
Additional CaliFormer companies identified since our last monthly report are shown below. The listed companies include those that have announced: (1) moving their headquarters or full operations out of state, (2) moving business units out of state (generally back office operations where the employees do not have to be in a more costly California location to do their jobs), (3) California companies that expanded out of state rather than locate those facilities here, and (4) companies turning to permanent telework options, leaving it to their employees to decide where to work and live. The list is not exhaustive but is drawn from a monthly search of sources in key cities.
