Highlights for policy makers:
- COVID-19 and the State Economy
- CaliFormer Businesses: Update
- CaliFormers: Business Closures & Recovery During the Pandemic
- CaliForming: Venture Capital Activity Boosts State Revenues
- Nonfarm Jobs: 498k Below Pre-Covid Peak
- Jobs Change by Industry
- Employment 774k Below Pre-Covid Level
- Unemployment Insurance Initial Claims Still Above Pre-Pandemic Averages
- Labor Force Participation Rate
- Unemployment Rates by Legislative Districts
- Unemployment Rates by Region
- MSAs with the Worst Unemployment Rates
- Technical Notes
COVID-19 and the State Economy
As discussed in our preliminary analysis, the January employment and jobs reports continue the annual revision process, with revised data for the states generally beginning in 2017 and for the counties starting in 2021. Additional county revisions and our legislative district estimates will be released later this month.
The revisions in general show improvements over the previously released results, with the pandemic period showing a slightly higher beginning level, and more importantly improved numbers over the subsequent months. The primary improvement was to the wage and salary job numbers; December’s level is 248,200 higher than the previous estimate, and the total jobs increase in 2021 comes in 95,400 higher. The employment revisions were less notable but still positive; December’s employment level is 14,100 higher than previously estimated, and the total increase is 13,200 higher.
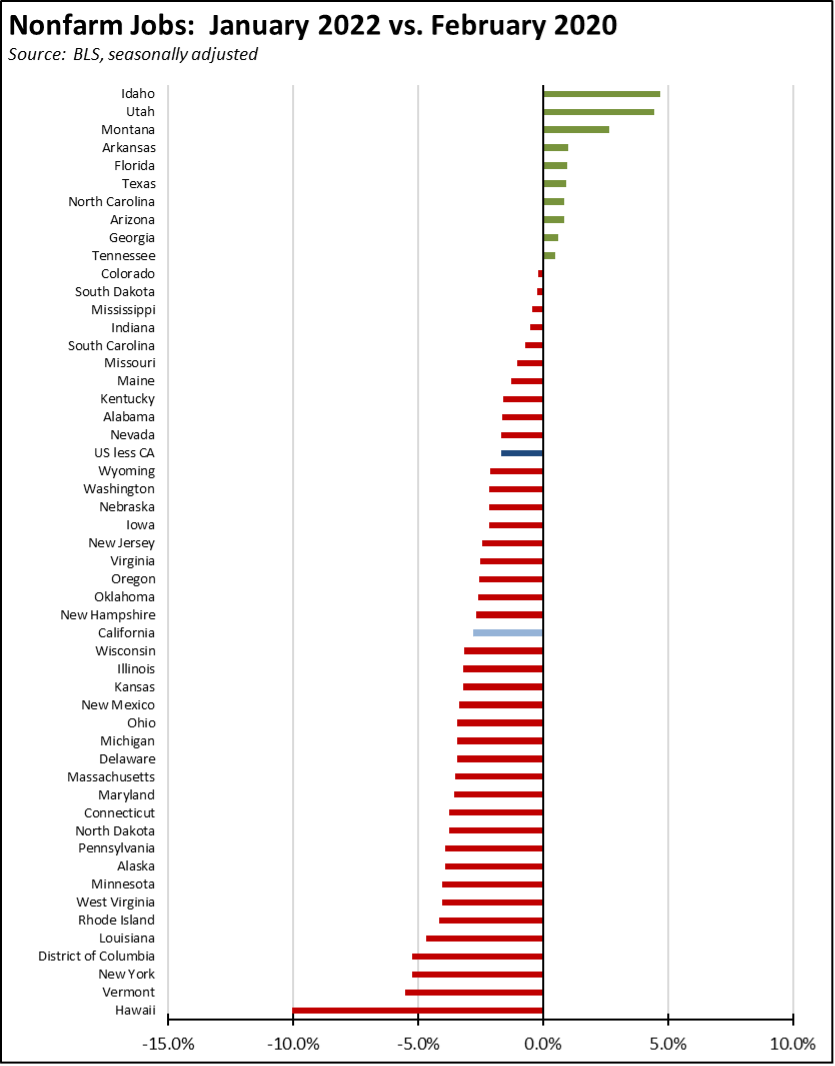
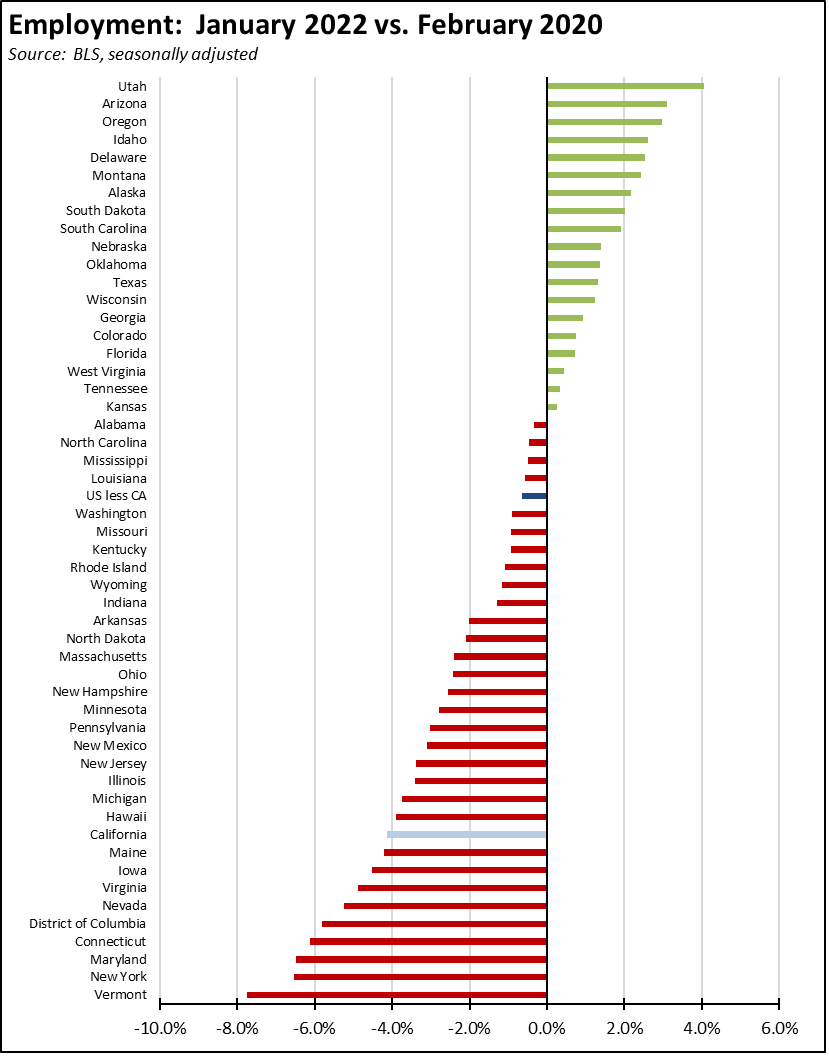
Even with these improvements, California continues to lag the rest of the nation in recovery. As measured against the pre-pandemic peak in February 2020, nonfarm jobs are still 2.8% short of recovery in California compared to 1.7% in the rest of the states. Employment is still 4.1% below compared to only 0.7% in the rest of the states.
In the January results, ten states are now above their pre-pandemic level, including Florida, Texas, Arizona, Utah, North Carolina, Georgia, and other states that have been the prime destinations for Californians moving from this state. The data revisions pushed California higher in this ranking, but the state’s jobs recovery level has moved to only the 30th highest.
Ranked by employment compared to the pre-pandemic level, 19 states—or approaching half—are now above recovery, with California showing only minor movement to the 42nd highest recovery rate.
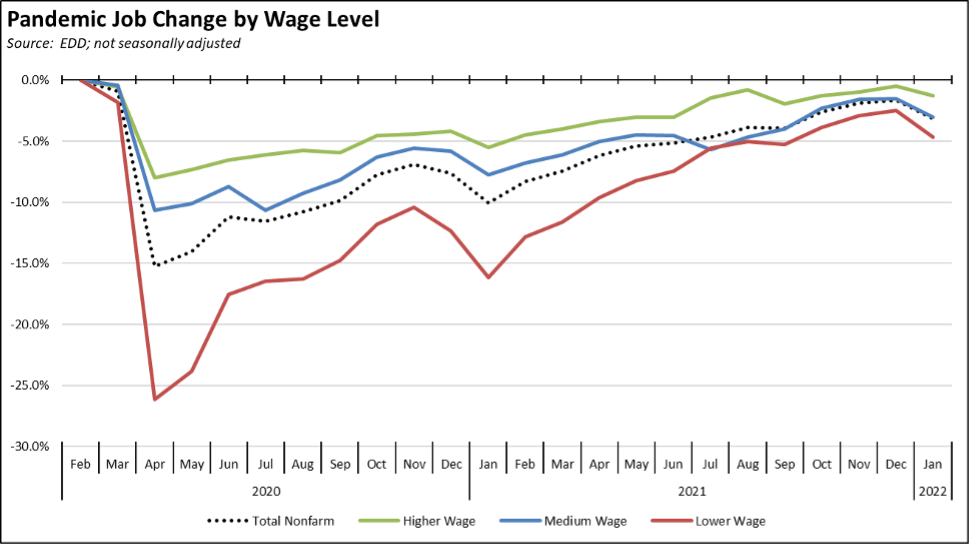
Using the unadjusted numbers, jobs by wage level continued to show the same pattern of recovery as previously reported. The higher-wage industries are just 1.3% shy of the pre-pandemic level. Medium wage industries now track the overall job change led by growth in Transportation & Warehousing. Lower-wage industries were still nearly 5% below. Just as importantly, however, the January dip illustrates that seasonal factors have again begun to be significant in the job results, which previously were overwhelmed by jobs being closed or reopened from the state-ordered closures rather than any inherent growth factors.
In the chart, higher-wage jobs are those industries with average annual wages above $100,000; medium wage is $50,000 to $100,000; and lower-wage is below $50,000. Job data is drawn from the industry classifications, unadjusted job numbers, and wage levels generally used in the regular report section below on Nonfarm Jobs.
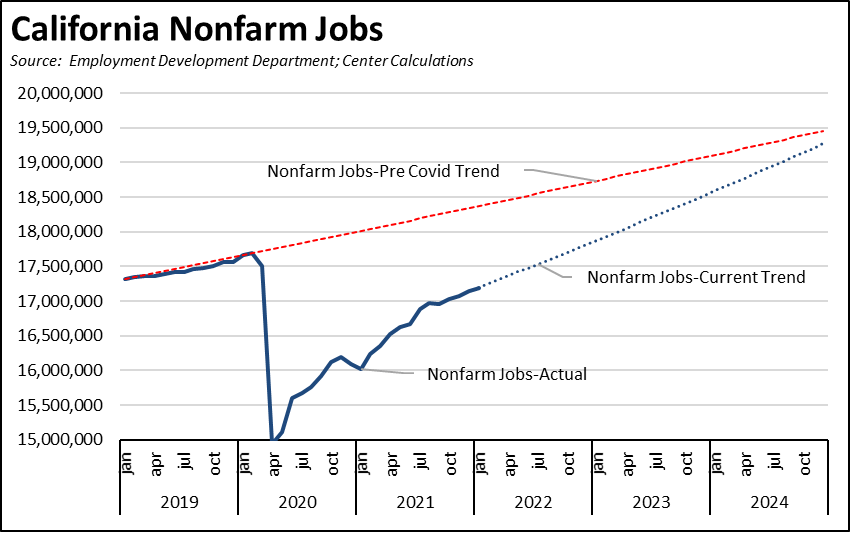
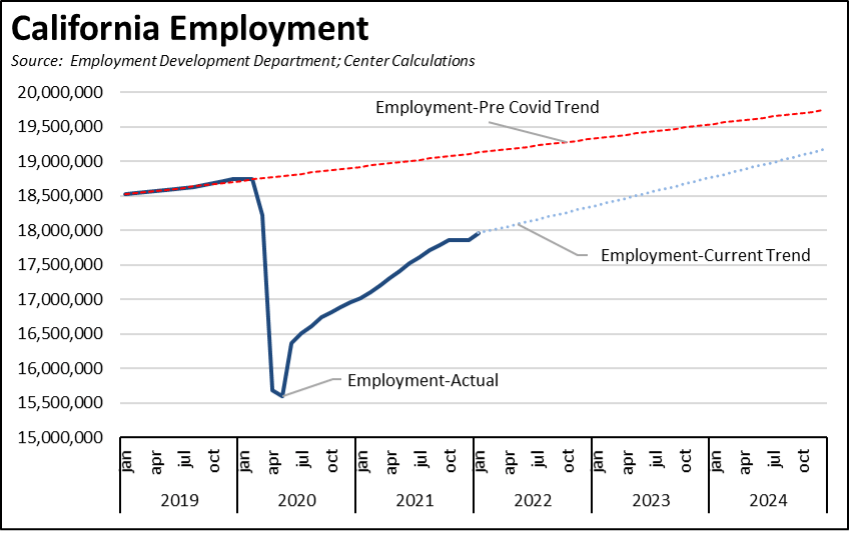
But while these numbers are positive, what do they really mean for return to economic health in the state? In general, the pace of recovery in California has been slowing, especially as measured by employment, as is illustrated in the following two charts. While most analyses consider recovery as passing the pre-pandemic peaks, the state-ordered shutdowns not only shuttered jobs but also cut back on the previous growth momentum seen in many industries in the state. Recovery, instead, also must consider how long it will take the state to return to these previous trends, particularly when a growing number of states, as discussed above, are already reaching this level.
The two charts are not projections, but instead are used to put the recent slowing job and employment trends in perspective. The Pre Covid trends are determined by applying the 2019 average growth rates to the revised February 2020 per-pandemic peak numbers. The Current Trend lines are based on the average changes reported for the state over the past three months.
As illustrated, the revised trends over the past three months suggest the state will return to the pre-pandemic job and employment levels by late 2022, if the numbers keep rising at these rates. The recovery rates over the past three months, however, have not been large enough to bring the state’s economy back to trend in this period. The state will not return to trend for jobs until sometime in 2025. Return to trend for employment is not likely to occur until several years more.
The numbers in recent months as shown in the revised data have been positive overall, but they have been strong enough to only take the state back to where it was and not to where it was going. Under current policies, the jobs and more critically the employment numbers are lagging. The state’s continued policy emphasis on income assistance rather than reforms to generate more concerted growth in jobs especially middle-class wage jobs puts it behind the other states in reaching this goal. The added factors coming from the war in Europe, the consequent sanctions, spiking energy prices, rapidly rising inflation, failure to meaningfully address the housing crisis, shortages likely to get worse from renewed factory closures in China due to Covid, and continued disruptions along with each point of the supply chains only increase the challenge of relying on policy as usual for the course of the state’s economy.
CaliFormer Businesses: Update
Additional CaliFormer companies identified since our last monthly report are shown below. Companies listed below include those that have announced: (1) moving their headquarters or full operations out of state, (2) moving business units out of state (generally back-office operations where the employees do not have to be in a more costly California location to do their jobs), (3) California companies that expanded out of state, and (4) companies turning to permanent telework options, leaving it to their employees to decide where to work and live. The list is not exhaustive but is drawn from a monthly search of sources in key cities.
While some tech businesses continue to move or locate expansions out of state, the Califormer tracking has shown a higher incidence of moves by manufacturing, back-office activities, and other jobs historically providing middle class wage levels in the state. It’s important to note that these were moves accomplished under the difficult circumstances existing during the pandemic, but the pandemic has also been a period providing a stress test highlighting the failures of state policies related to housing, energy prices and other costs of living, and a narrow focus on infrastructure somehow brought under a “climate change” justification rather than the broader systems required for the state to be competitive in both the national and global economies. As the economy moves to a more open phase, the question becomes the potential effect on the ease of migration out of the state.
Migration, however, is not just limited to companies. The state’s population declined for the first time in history because more households found opportunity, particularly through lower costs of living, now lie outside this state. This factor is likely to increase due to telework becoming a permanent feature of work, especially within the tech industries on which the state’s outsized GDP and public revenue growth depend. While the level of net migration out of the state increased during the pandemic, the portion related to telework appears to date to have sparked more moves within the state rather than to other states. However, a recent survey by Upwork found that 2.4% of workers nationally have already moved because of remote work since 2020, but that 9.3% are now planning to do. Of those planning to move because of remote work, 28% intend to move more than 4 hours away from their current location, while another 13% to plan to move between 2 and 4 hours away.
| wdt_ID | Companies | From | To | Reason | Source | Year |
|---|---|---|---|---|---|---|
| 167 | AgShift | Costa Mesa | Albuquerque | HQ move | Read More | 2022 |
| 168 | CelLink | San Carlos | Texas | Manufacturing expansion | Read More | 2022 |
| 169 | Envirotech Vehicles | Corona | Arkansas | Electric vehicle HQ & manufacturing move | Read More | 2022 |
| 170 | G3 Enterprises Inc. | Modesto | Arizona | Expansion | Read More | 2022 |
| 171 | Gatik | Palo Alto | Texas | Expansion | Read More | 2021 |
| 172 | Hyperion Companies (hydrogen fuel cells) | Orange | Ohio | HQ & manufacturing move | Read More | 2022 |
| 173 | Infinium | Sacramento | Texas | Manufacturing (synthetic diesel from CO2 emissions) expansion | Read More | 2022 |
| 174 | Kodiak Robotics | Mountain View | Dallas | Expansion | Read More | 2022 |
| 175 | McKinley Packaging | Santa Fe Springs | Texas | Manufacturing (packaging from recycled materials) expansion | Read More | 2022 |
| 176 | Meta | Menlo park | Austin | Expansion--leased 33 floors in city's highest building | Read More | 2022 |
| Companies | From | To | Reason | Source | Year |
CaliFormers: Business Closures & Recovery During the Pandemic
In addition to companies moving operations out of state, circumstances during the pandemic—including the shift in consumer spending patterns and the continuing shift in state policies affecting employer operating conditions and costs—have led to the closure of all or part of many businesses, especially those unable to shift to telework, internet-based sales, or other operational changes. Data on this topic comes from two sources, but both have substantial lags. In both cases, the data is for businesses with wage and salary employees and does not include self-employed businesses.
Bureau of Labor Statistics and EDD produce data on business deaths and births at the establishment level, where an individual firm may operate one or multiple establishments within the state. For comparison purposes, Census Bureau data for 2019 shows each firm in California operated an average of 1.24 establishments, ranging from 1.02 establishments per firm in Other Services to 2.34 in Utilities.
Under this Business Employment Dynamics series, establishment closings and openings are available with a lag of three quarters. This data covers both establishments that are closed/opened permanently along with those that operate only seasonally and that may open and close during the year but continue to operate as an ongoing concern. Permanent closures/openings instead are covered under establishment deaths and births, with the death data having an additional 3-quarter lag due to the way it is calculated. Complete data from this source on the number of establishments permanently closed through the current period consequently will not be available until towards the end of 2023.
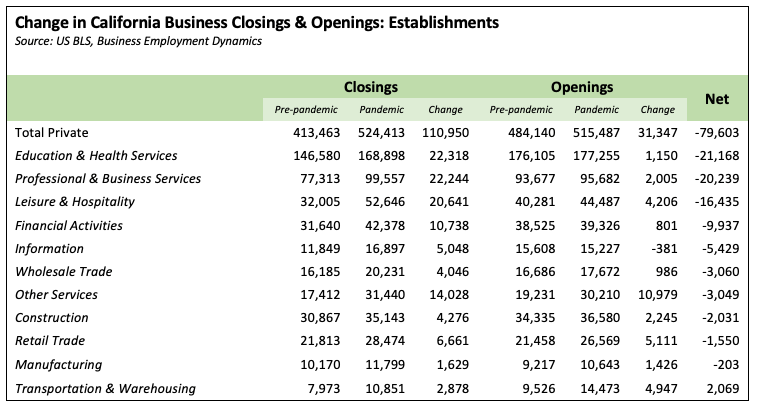
Openings and closings can be used as an indicator to provide a more recent picture. The tables below compare the totals during the available pandemic period data (2020:Q1 through 2021:Q2) to the immediately preceding pre-pandemic period (2018:Q3 through 2019:Q4) to assess the change in business flows during comparable quarters. Note that this data includes seasonal openings and closings, but the use of multiple quarters for comparison will net out most of this effect.
In the first table, this analysis indicates the pandemic through the second quarter of 2021 saw the closure of an additional 81,672 establishments, with a net change of 79,603 after the growth in Transportation & Warehousing is factored in. These establishment closings were led by Education & Health Services, followed by Professional & Business Services and by Leisure & Hospitality. Transportation & Warehousing fueled by efforts to combat the supply chain disruptions was the only industry to post a net gain.
This data also illustrates that establishments did not just close in this period, but there was also substantial activity as new ones were opened. Several industries saw an increase in openings either because of shifting consumer demand (e.g., Health Services and internet-based retail sales) or as in the case of Professional & Business Services, the tech component expanded during the pandemic due to their rapid shift to alternative operating modes.
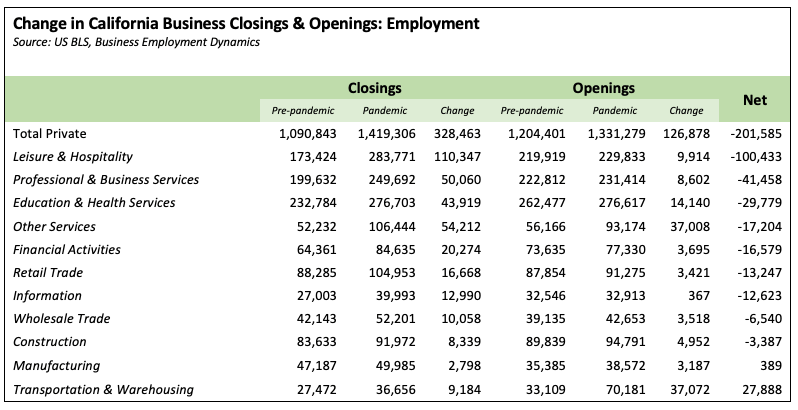
Measured by employment, the pattern is somewhat changed. Overall, the flow in the number of establishments resulted in an additional loss of 229,862 jobs, offset by gains in two industries for a net reduction of 201,585. The greatest loss from closings was in Leisure & Hospitality at more than twice the level for the second largest, Professional & Business Services.
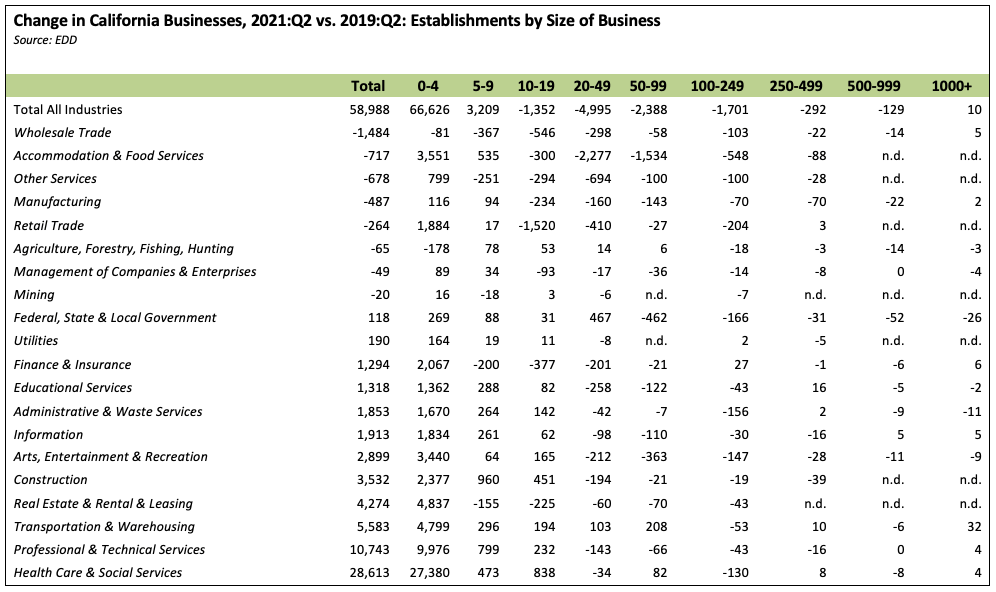
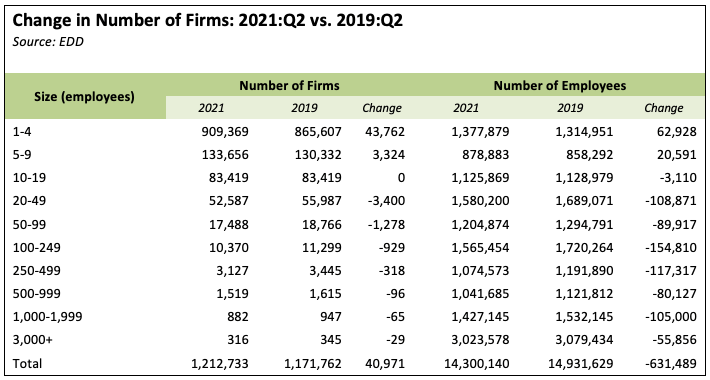
There has been considerable movement within each of these industries, with most of the losses taken by medium-sized businesses and growth within smaller ones including sole person establishments. Comparing the most recently available second-quarter results by size of business in 2021 with the same quarter in pre-pandemic 2019, the number of establishments grew by 58,988, but only as a loss (both from closures and establishments reducing their jobs) of 10,857 establishments in the 10-999 employee range was offset by an increase of 69,835 in the 0-9 employee range plus an additional 10 moving into the 1000+ range. Note that in some cases, the data in the table was not reported (n.d.) due to non-disclosure requirements.
This effect was even more notable within specific industries. Accommodation & Food Services saw a 4,747 loss in all establishments of 10 employees or more, partially offset by a gain of 4,086 in the 0-4 range. Other Services had a loss of 1,467 in all establishments of 5 employees and over, with the gain of 799 only in the 0-4 range.
The other data series, the Business Dynamics Statistics from the US Census Bureau, provides similar data but on the firm level. Drawn from the same core data source, information on firm deaths through the current quarter also will not be available until towards the end of 2024.
EDD, however, provides quarterly data on the number of firms in California by the size of business. Comparing the most recent second-quarter data with the same period in pre-pandemic 2019, California has seen an increase of 43,762 firms operating in the state. As with the establishment data, however, there has been a loss of 6,115 firms of 10 or more employees (either through closure or shrinkage of firms) offset by an increase of 47,086 firms of smaller size. By employment, the larger firms combined show a jobs loss of 715,008, offset by a gain of only 83,519 in those of 9 employees or fewer.
Combining these various sources indicates there has been a substantial loss of previously established businesses, replaced primarily as workers now seek to open their own business rather than return to a normal wage and salary job. While losses have been heavy within the hard-hit Accommodations, Food Services, and tourism-related industries, these are by no means the only portions of the economy showing losses.
The challenge especially for a broader-based recovery providing a range of wage levels beyond the two-tier, higher and lower ends only experienced in the previous recovery then becomes the extent to which these new, smaller companies prosper and grow in a state long known for its high regulations and high taxes and fees.
In a recent Alignable poll of business owners, only 21% indicated that the federal government is doing a good job for their business, but the response varied widely with small businesses responding positively by only 16%, traditional middle-class wage industries much lower (manufacturing 9%, construction 12%, transportation 9%), and the “laptop class” less affected by the pandemic closures far higher (music/artists/performers 47%, law firms/attorneys 45%, nonprofits 41%). Of the states reported, California was the third-lowest at 22% saying that their state was doing a good job for their business, while the states leading in job creation came in higher including Florida leading at 59%, Texas at 52%, and Georgia at 51%.
CaliForming: Venture Capital Activity Boosts State Revenues
Our CaliFormer series initially began after media reports in 2020 about a possible tech exodus from the Bay Area and California. These reports were stimulated in large part by the decisions of such tech icons as HP and Oracle to shift their headquarters to emerging tech centers in other parts of the country and as teleworking made it possible for tech workers—and the taxable base from their incomes—to locate anywhere in the country. The CaliFormer series is an attempt to track this trend over time and provide more information on its significance particularly as the easing of the pandemic restrictions now makes such moves more feasible in the upcoming years.
The state’s tech center particularly in the Bay Area, however, continues as a prime source of new businesses and new jobs, drawing on its strengths including a continued lead as the center for these industries, a supportive research component in the region’s universities and national labs, and an active venture capital sector turning ideas into jobs. For many entrepreneurs at least to date, these strengths continue to outweigh the rising costs of operating in California both for their businesses and their employees.
As contained in the annual updates from Pitchbook, venture capital activity in 2021 soared to new levels despite the pandemic conditions and likely in part because of them as shifts to telework and other changes quickly expanded the operational flexibility for these companies. Pitchbook reports that US venture capital deals increased 40% to just over 17,000, while the value of these deals nearly doubled to $330 billion.
The Bay Area continues to be the largest source of these deals, with Los Angeles still coming in at a somewhat more distant third. Although its dominance has declined somewhat as venture capital has spread to other emerging centers, the Bay Area accounted for about a third of all US deals by value for the past three years.
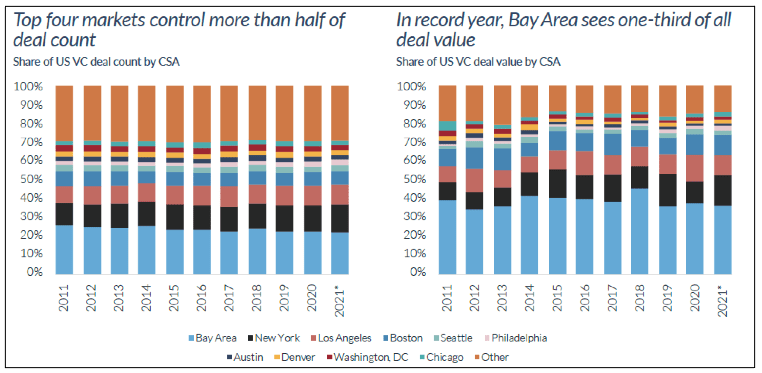
Source: As contained in Pitchbook & NVCA, Venture Monitor, Q4 2021
Pitchbook also reports that venture capital exits were up even higher in 2021. Nearly 90% of the exit value was through public listings, including both IPOs and SPACs, and the remainder from acquisitions.
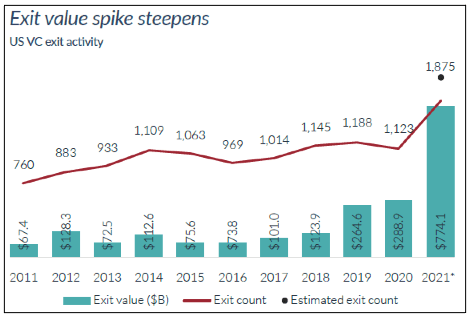
Source: As contained in Pitchbook & NVCA, Venture Monitor, Q4 2021
This spike in overall venture capital activity and in particular exits has had a direct and significant effect on state revenues. Rather than the large deficits assumed in the 2020-21 Budget Bill, the state instead has seen large budget surpluses and record revenue levels as the result of this upswing in its increasingly volatile revenue base. The rapid shift of tech and other businesses to telework and other operational changes largely sheltered higher-income workers from the effects of the state-ordered shutdowns. Capital gains from both IPOs and the previous stock market highs contributed heavily to the surging surpluses.
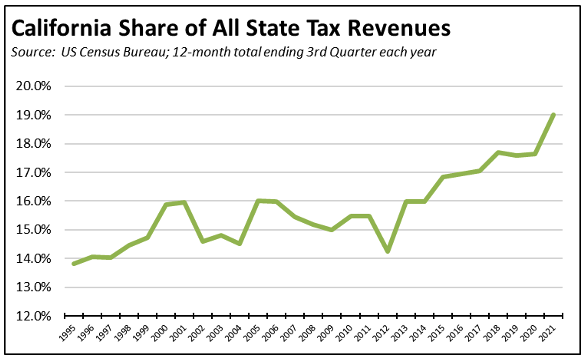
This rise in state tax revenues is easily outpacing the rest of the nation, and in fact, tax revenues in California have grown more strongly than in the other states nearly every year since the beginning of the previous recovery after 2012. California tax revenues have grown both as the revenue base has produced more and as the state has increased the number and rates of taxes in this period.
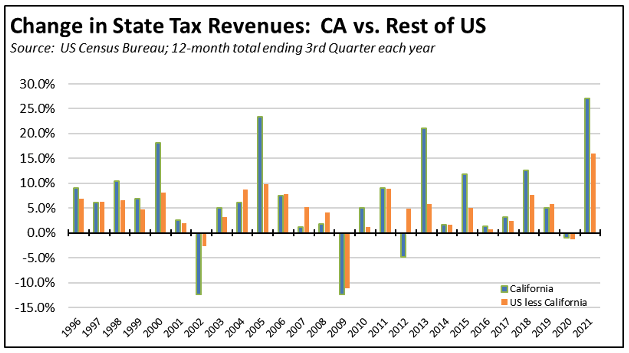
The most recent Census Bureau data used in the table above reports for the third quarter of 2021. Consequently, the data shown is for 12 months ending with the third quarter in each year, an adjustment that provides a consistent base for comparison as well as accounting for recent shifts in tax due dates during the pandemic period. Revenue sources covered in this data includes property taxes, sales and gross receipts taxes (general and selective), license taxes, income taxes (individual and corporate), and other taxes.
The expansion of tax revenues is also shown in California’s increasing share of the total taxes levied by all states. While California is about 12% of the nation as measured by population or its economy, its high tax status has always put this share somewhat above. The amount of this above, however, has been growing sharply. Again, using the annualized data as above, California in 1995 produced 13.8% of the total state tax revenues in the nation. In the most recent data, California’s share is just short of one-fifth of all state taxes, at 19.0%.
Nonfarm Jobs: 498k Below Pre-Covid Peak
Nonfarm wage and salary jobs were up 53,600 (seasonally adjusted) in January, while gains in December were revised to 62,900 from the previously reported 111,600.
California showed the largest monthly increase, followed by New York at 36,800 and Texas at 29,000. As indicated above, 10 states are now above the February 2020 pre-pandemic peak. California remains 498,000 behind or 17.9% of the remaining national shortfall.
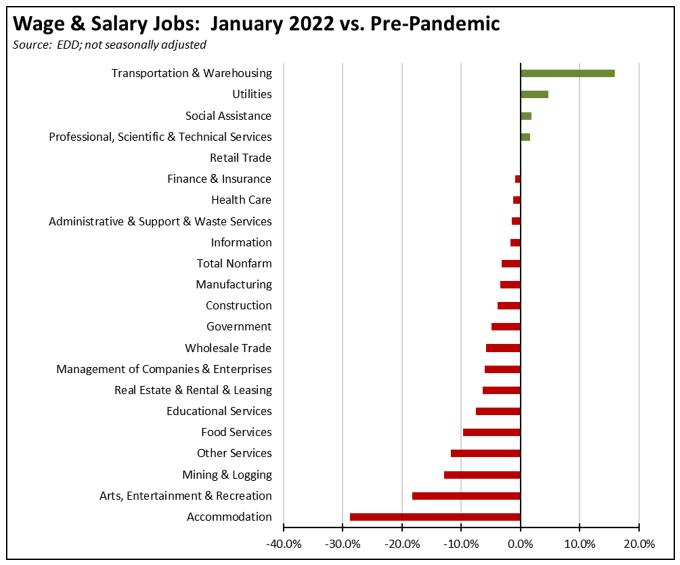
Jobs Change by Industry
Using the unadjusted numbers that allow a more detailed look at industry shifts, the number of industries that showed job levels at or exceeding the pre-pandemic February 2020 levels based on the revised data remained at 5. Transportation & Warehousing by a substantial margin shows the strongest growth as companies continue to battle the ongoing supply chain disruptions. The biggest lags in recovery continue to be the lower-wage industries that were hardest hit by the state-ordered closures along with Mining & Logging is being targeted for reduced job numbers under current state policies.
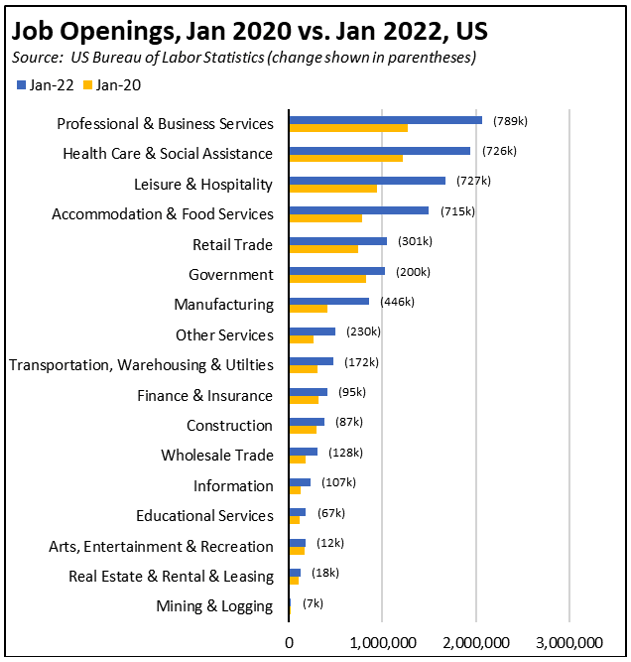
Labor shortages continue to be a factor affecting the prospects and potential pace of future increases within each industry. Job openings reached a new series high at 1.192 million in California in December and the second-highest at 11.263 million for the US in January. While industry breakdowns are available only for the national data, a comparison of the latest US data to the pre-pandemic levels in January 2020 indicates where these shortages are the most pressing.
As shown, the most substantial increases in labor shortages have been in Professional & Business Services and Health Care & Social Assistance. While the concept of labor shortages has been dismissed by some commenters as employers simply not raising wages fast enough, these results instead suggest challenges to the continued ability of the state to rely on two key industries providing both income and public revenue growth. Competition for labor under these conditions will remain high, with other centers in the US offering both higher wages and lower living costs likely gaining ground. Manufacturing with the fifth-highest shortage increase illustrates the continuing challenge of countering the supply shortages that have led to growing inflation.
Employment 774k Below Pre-Covid Level
EDD reported that employment (seasonally adjusted; January preliminary) was up 109,200 from the revised December numbers, reversing declines shown in the previous two months in the revised data. The number of unemployed was up by only 9,300.
The reported unemployment rate was level at 5.8% for the third month in a row under the revised data, compared to the revised 4.1% in February 2020 prior to the pandemic. California had the third-highest unemployment rate among the states, ahead of only DC and New Mexico. California contained 17.0% of the total number of unemployed workers in the US.
In the national numbers, total US employment rose 1,199,000, and the number of unemployed was up by 194,000. As the labor force expanded, the reported unemployment rate edged up 0.1 point to 4.0%, closing in on the 3.5% rate recorded in February 2020.
Figure sources: California Employment Development Department; US Bureau of Labor Statistics
In the seasonally adjusted numbers, California employment remains 773,600 (4.1%) below the pre-pandemic level in February 2020; the rest of the states combined were 0.7% below.
Unemployment Insurance Initial Claims Still Above Pre-Pandemic Averages
The number of weekly initial claims in February showed improvement over January, but in another indication of the state’s lagging recovery, remained above the 2019 pre-pandemic average in California. The average in February (weeks ending February 5 through February 26) was 43,700 in California, below the 57,400 average in January (weeks ending January 8 through January 29). The preliminary report for the week ended March 5 at 44,376 was also in line with this level.
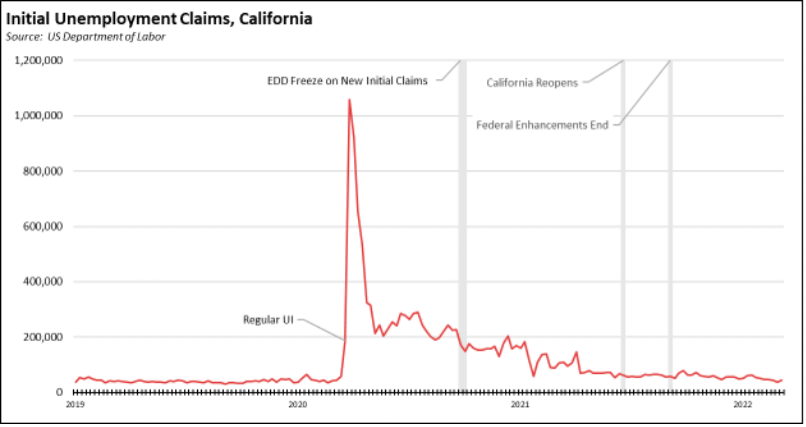
The national (unadjusted) numbers showed substantially more improvement, dropping from a weekly average of 322,000 in January to 220,600 in February and 218,072 in the preliminary result for the week ended March 5. The California numbers are 8% above the pre-pandemic averages in 2019, while the total national numbers are only 2% above and the national numbers for all states other than California are basically at the 2019 recovery level.
Based on the March average numbers, California contained 20% of all initial claims nationally. As of February 26, California contained 22% of the insured unemployed (a proxy for the number of continuing claims).
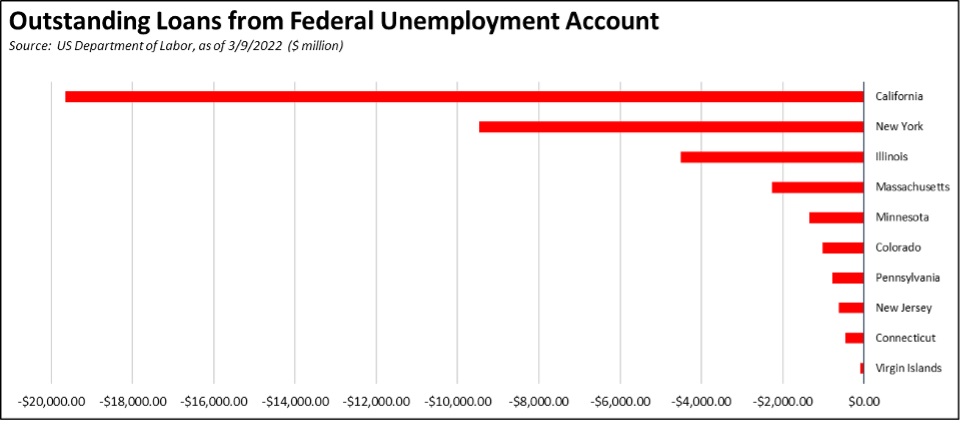
California unemployment insurance fund debt showed little movement, coming in at $19.7 billion as of March 9, or 49% of the total owed by all the states and territories.
Labor Force Participation Rate
The labor force participation rate rose 0.4 point to 61.5%, while the US number was up 0.3 point to 62.2%. The California rate remains well below the pre-pandemic level of 62.8%, which in turn was down substantially from prior years. Accounting for workers leaving the workforce since February 2020, there were an estimated 1.4 million out of work in January.
Unemployment Rates by Legislative Districts
The highest and lowest estimated unemployment rates in January are shown below.
Lowest
Highest
Unemployment Rates by Region
Unemployment rates (not seasonally adjusted) compared to pre-pandemic February 2020 are shown below. The February 2020, rates, however, are based on data that has not yet revised, but are shown for comparison purposes.
Figure Source: California Employment Development Department
MSAs with the Worst Unemployment Rates
California edged up to 11 of the MSAs among the 25 regions with the worst unemployment rates in December, including El Centro MSA (Imperial County) with the worst unemployment rate in the nation. Los Angeles-Long Beach-Anaheim MSA moved out of this group by rising to #358. The best performing California urban region was again San Jose-Sunnyvale-Santa Clara MSA tied with St. Louis MSA at #147, with an unemployment rate of 3.0% compared to the best performing MSA, Elkhart-Goshen, IN MSA at 0.9%. Note that the unemployment rates shown in the table reflect the 2021 data prior to this month’s revisions.
Technical Notes
The Center’s data will continue to be updated this month as the annual data revisions are released by BLS and EDD.
In addition, the final approved maps by the 2020 California Citizens Redistricting Commission have been released. The Center for Jobs will be updating the California maps and data across the website in early 2022 to reflect the new legislative district boundaries. We will continue to cover data for the 2012 district boundaries throughout most of the year, but will begin to transition to the 2022 district data and estimates as this information is developed.