Download July 2018 Jobs Report
Highlights for policy makers:
- Unemployment Rate Level at 4.2%; Total Employment Up 13,500
- Labor Force Participation Rate Level at 61.9%
- State Employment Growth Rankings—California Drops to 5th
- Nonfarm Jobs Up 46,700
- Four Industries Still below 2007 Pre-Recession Job Levels
- Job Gains by Wage Level
- Two-Tier Economy Persists—Central Valley Unemployment More than Twice as High as Bay Area
- Bay Area Provided 40.4% of Net Employment Growth Since Recession
- Nine California MSAs in the 10 Worst Unemployment Rates Nationally
Unemployment Rate Level at 4.2%; Total Employment up 13,500
The Labor Force data for July 2018 (seasonally adjusted; California preliminary) is shown below, along with the change from the prior month:
| Seasonally Adjusted | California | US | ||
|---|---|---|---|---|
| Jul 2018 | Change from Jun 2018 | Jul 2018 | Change from Jun 2018 | |
| Unemployment Rate | 4.2% | 0.0 | 3.9% | -0.1 |
| Labor Force | 19,348,000 | 0.0% | 162,245,000 | 0.1% |
| Participation Rate | 61.9% | 0.0 | 62.9% | 0.0 |
| Employment | 18,540,600 | 0.1% | 155,965,000 | 0.3% |
| Unemployment | 807,400 | -0.8% | 6,280,000 | -4.3% |
The related not seasonally adjusted numbers (California preliminary), with the change from July 2017:
| Not Seasonally Adjusted | California | US | ||
|---|---|---|---|---|
| Jul 2018 | Change from Jul 2017 | Jul 2018 | Change from Jul 2017 | |
| Unemployment Rate | 4.4% | -0.7 | 4.1% | -0.5 |
| Labor Force | 19,469,500 | 0.3% | 163,734,000 | 1.1% |
| Participation Rate | 62.3% | -0.3 | 63.5% | 0.0 |
| Employment | 18,613,000 | 1.1% | 157,004,000 | 1.6% |
| Unemployment | 856,500 | -14.0% | 6,730,000 | -9.6% |
California Employment Development Department’s (EDD) latest data shows on a seasonally adjusted basis, total employment rose 13,500 from June, while the number of unemployed fell 6,800. The labor force notched up by 6,700.
California’s seasonally adjusted unemployment rate remained at 4.2%, the lowest level in the current data series that began in 1976. California tied with Illinois, New Jersey, and Pennsylvania for the 16th highest unemployment rate among the states. The unadjusted rate dropped from 5.1% in July 2017 to 4.4%.
Total US employment saw a seasonally adjusted gain of 389,000 from June, while the number of unemployed dropped by 284,000 as the total labor force grew by 105,000. The national unemployment rate dipped to 3.9%.
Labor Force Participation Rate Level at 61.9%
California’s participation rate (seasonally adjusted) in July remained at 61.9%, while the US rate stayed at 62.9%. The California rate matched the revised series low reached previously in 2015.
California’s labor force grew only 16,922 over the year ending July 2018, or 0.1% growth. The US as a whole grew 1.8 million – a 1.1% expansion. While workers elsewhere continue to return to the workforce, California’s continued low rate has implications for future growth in the state, including the ability to sustain jobs expansion as fewer workers are available and continued effects on state and local budgets for higher social program spending compared to other states.
Considered by age, the prime working age groups in California (age 25-54 and 55-64) remain somewhat below their previous highs since 2000, with youth employment remaining below levels from a year ago. These trends, in particular, have long-term implications for income distributions in the state, as most studies indicate that work skills developed through early employment are correlated with long-term earnings potential. In contrast to the younger groups, persons 65 and older show a higher labor force participation rate compared to the prior low at the beginning of this period.
Labor Force Participation Rate by Age (12-month moving average)
| Prior Max | July 2018 | |
|---|---|---|
| Total | 67.2% | 62.2% |
| 16-19 | 46.8% | 27.2% |
| 20-24 | 76.4% | 65.9% |
| 25-54 | 82.1% | 80.3% |
| 55-64 | 66.3% | 63.5% |
| Prior Min | ||
| 65+ | 12.1% | 19.7% |
State Employment Growth Rankings—California Drops to 5th
Change in Employment, July 2017 – July 2018
| Rank | Number of Employed | Percentage Change | Population Adjusted (employment growth per 1,000 civilian noninstitutional population) |
|---|---|---|---|
| 1 | TX 295,200 | MA 3.5% | MA 22.4 |
| 2 | FL 160,100 | CO 2.9% | CO 19.2 |
| 3 | MA 124,900 | NV 2.7% | DC 16.7 |
| 4 | GA 121,300 | NM 2.6% | NV 16.2 |
| 5 | CA 120,600 | DC 2.5% | ID 15.3 |
| 6 | CO 84,400 | GA 2.5% | GA 15.1 |
| 7 | NC 70,100 | ID 2.5% | DE 14.5 |
| 8 | VA 66,700 | DE 2.4% | NM 14.1 |
| 9 | AZ 60,900 | TX 2.3% | UT 14.0 |
| 10 | IN 58,200 | UT 2.1% | TX 13.9 |
| 11 | MN 56,200 | AZ 1.9% | MN 12.9 |
| 12 | IL 49,100 | OK 1.9% | OK 11.3 |
| 13 | TN 46,700 | MN 1.9% | IN 11.2 |
| 14 | NV 38,000 | IN 1.8% | AZ 11.1 |
| 15 | OH 37,600 | FL 1.6% | VA 10.1 |
| 16 | WI 36,800 | VA 1.6% | NH 10.0 |
| 17 | MI 34,800 | RI 1.6% | RI 9.7 |
| 18 | WA 34,300 | NH 1.5% | FL 9.4 |
| 19 | OK 33,900 | TN 1.5% | VT 9.3 |
| 20 | UT 31,500 | NC 1.5% | TN 8.8 |
| 21 | AL 28,100 | VT 1.4% | NC 8.7 |
| 22 | LA 27,800 | LA 1.4% | WI 8.0 |
| 23 | NM 22,800 | AL 1.4% | LA 7.7 |
| 24 | KY 22,500 | WI 1.2% | AL 7.3 |
| 25 | ID 19,900 | KY 1.1% | SD 7.1 |
| 26 | MO 16,200 | SD 1.1% | KY 6.5 |
| 27 | IA 13,100 | ME 1.0% | ME 6.4 |
| 28 | OR 11,700 | WA 1.0% | WA 5.9 |
| 29 | SC 11,300 | IA 0.8% | IA 5.3 |
| 30 | DE 11,100 | NE 0.8% | NE 5.3 |
| 31 | NH 11,000 | IL 0.8% | IL 4.9 |
| 32 | DC 9,500 | MS 0.8% | MI 4.4 |
| 33 | MS 9,200 | MI 0.7% | HI 4.3 |
| 34 | RI 8,400 | HI 0.7% | OH 4.1 |
| 35 | NE 7,800 | OH 0.7% | MS 4.0 |
| 36 | ME 7,100 | CA 0.7% | CA 3.9 |
| 37 | VT 4,800 | OR 0.6% | OR 3.5 |
| 38 | HI 4,700 | MO 0.6% | MO 3.4 |
| 39 | SD 4,700 | WV 0.5% | SC 2.9 |
| 40 | WV 3,900 | SC 0.5% | WV 2.7 |
| US 2,454,000 | US 1.6% | US 9.6 |
Between July 2017 and July 2018, Bureau of Labor Statistics (BLS) data shows the total number of employed in California increased by 120,600 (seasonally adjusted), or 4.9% of the total net employment gains in this period for the US. Based on the total numbers, California dropped to 5th place behind Texas (which has a civilian working-age population only 69% as large as California’s), Florida (55% as large), Massachusetts, and Georgia. Measured by the percentage change in employment over the year, California dropped to 36th highest. Adjusted for working-age population, California dropped to 36th as well.
Nonfarm Jobs Up 46,700
EDD reported that between June and July 2018, seasonally adjusted nonfarm wage and salary jobs grew by 46,700. June’s results were revised to a 21,500 gain from the previously reported 800.
In the not seasonally adjusted nonfarm numbers that allow a more detailed look at industry shifts, hiring saw increases in all but 3 industries over the year. The change in total payroll jobs from July 2017 saw the largest increases in Food Services (46,700), Construction (37,500), and Government (32,700). Declines were in Real Estate & Rental & Leasing (-1,400), Mining & Logging (-400), and Utilities (-100).
| Not Seasonally Adjusted Payroll Jobs | Jul 2018 | Jun 2018 | Change Jul 2018 – Jun 2018 | Change Jul 2018 – Jul 2017 |
|---|---|---|---|---|
| Total Farm | 479,000 | 490,600 | -11,600 | 3,500 |
| Mining and Logging | 22,700 | 22,200 | 500 | -400 |
| Construction | 867,300 | 863,500 | 3,800 | 37,500 |
| Manufacturing | 1,329,900 | 1,319,700 | 10,200 | 6,800 |
| Wholesale Trade | 728,200 | 724,300 | 3,900 | 1,400 |
| Retail Trade | 1,689,200 | 1,680,400 | 8,800 | 11,600 |
| Utilities | 58,100 | 58,100 | 0 | -100 |
| Transportation & Warehousing | 589,600 | 584,500 | 5,100 | 26,300 |
| Information | 544,100 | 537,300 | 6,800 | 17,400 |
| Finance & Insurance | 548,800 | 545,800 | 3,000 | 100 |
| Real Estate & Rental & Leasing | 286,500 | 287,500 | -1,000 | -1,400 |
| Professional, Scientific & Technical Services | 1,270,800 | 1,268,900 | 1,900 | 30,800 |
| Management of Companies & Enterprises | 235,900 | 234,800 | 1,100 | 3,300 |
| Administrative & Support & Waste Services | 1,135,000 | 1,127,600 | 7,400 | 29,200 |
| Educational Services | 355,100 | 369,200 | -14,100 | 22,000 |
| Health Care | 1,531,400 | 1,525,800 | 5,600 | 29,100 |
| Social Assistance | 796,600 | 804,400 | -7,800 | 23,900 |
| Arts, Entertainment & Recreation | 329,700 | 321,300 | 8,400 | 6,700 |
| Accommodation | 238,200 | 239,100 | -900 | 5,800 |
| Food Services | 1,477,800 | 1,465,500 | 12,300 | 46,700 |
| Other Services | 567,700 | 570,200 | -2,500 | 1,900 |
| Government | 2,450,000 | 2,627,900 | -177,900 | 32,700 |
| Total Nonfarm | 17,052,600 | 17,178,000 | -125,400 | 331,300 |
| Total Wage and Salary | 17,531,600 | 17,668,600 | -137,000 | 334,800 |
At a 332,700 increase, California remained at 2nd highest measured by seasonally adjusted nonfarm jobs among the states from July 2017 to July 2018, behind Texas at 377,100. By percentage growth in jobs, California rose to 11th highest at 2.0%, above the US average. By population adjusted jobs growth, California rose to 17th highest.
Change in Nonfarm Jobs (seasonally adjusted), July 2017 – July 2018
| Rank | Number of Jobs | Employment Growth (%) | Population Adjusted (jobs growth per 1,000 civilian noninstitutional population) |
|---|---|---|---|
| 1 | TX 377,100 | UT 3.5% | UT 22.7 |
| 2 | CA 332,700 | NV 3.4% | NV 19.6 |
| 3 | FL 210,600 | ID 3.4% | ID 18.6 |
| 4 | NY 117,000 | TX 3.1% | TX 17.7 |
| 5 | NC 106,900 | WA 3.1% | CO 17.7 |
| 6 | WA 102,500 | CO 2.9% | WA 17.6 |
| 7 | GA 83,200 | OR 2.5% | OR 14.3 |
| 8 | OH 82,200 | FL 2.5% | NC 13.3 |
| 9 | CO 77,700 | NC 2.4% | DC 12.8 |
| 10 | NJ 75,500 | AZ 2.2% | FL 12.4 |
| 11 | PA 71,900 | CA 2.0% | WY 12.3 |
| 12 | MA 66,800 | WY 2.0% | MA 12.0 |
| 13 | MI 66,300 | HI 1.9% | NE 11.9 |
| 14 | IL 65,700 | NH 1.9% | NH 11.6 |
| 15 | VA 62,600 | TN 1.9% | HI 11.6 |
| 16 | AZ 61,100 | GA 1.9% | AZ 11.2 |
| 17 | TN 56,300 | RI 1.9% | CA 10.7 |
| 18 | UT 51,100 | MA 1.8% | RI 10.7 |
| 19 | OR 47,700 | NJ 1.8% | TN 10.7 |
| 20 | NV 46,000 | OK 1.8% | KS 10.5 |
| 21 | MN 43,100 | NE 1.7% | NJ 10.5 |
| 22 | WI 38,800 | KS 1.7% | GA 10.4 |
| 23 | SC 34,800 | SC 1.7% | MN 9.9 |
| 24 | MO 34,700 | NM 1.6% | OK9.8 |
| 25 | OK 29,500 | VA 1.6% | VA 9.5 |
| US2,400,000 | US1.6% | US9.4 |
Four Industries Still below 2007 Pre-Recession Job Levels
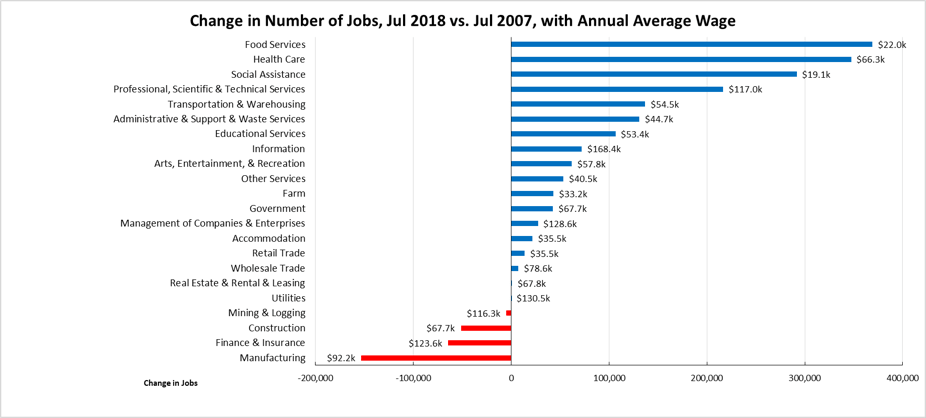
Comparing the number of jobs by industry in July 2018 (not seasonally adjusted), 4 industries had employment below the 2007 pre-recession levels. The highest gain industries were led by lower wage Food Services, Health Care (with a relatively higher mix of lower and higher wage occupations), lower wage Social Assistance, and higher wage Professional, Scientific & Technical Services. Of the lagging industries, three—Manufacturing, Mining & Logging, and Construction—are blue-collar middle-class wage industries, while the higher wage Finance & Insurance also remained in the minus column. Construction has overall improved but still remains 52,500 below the 2007 level, and 99,000 (10.2%) below the previous high in 2006.
In addition, higher wage Utilities and middle-class wage Real Estate, Rental, & Leasing edged closer to their 2007 levels, with a combined total of only 700 jobs in the plus column. In spite of trade jitters, blue-collar middle-class wage Transportation & Warehousing continued growing.
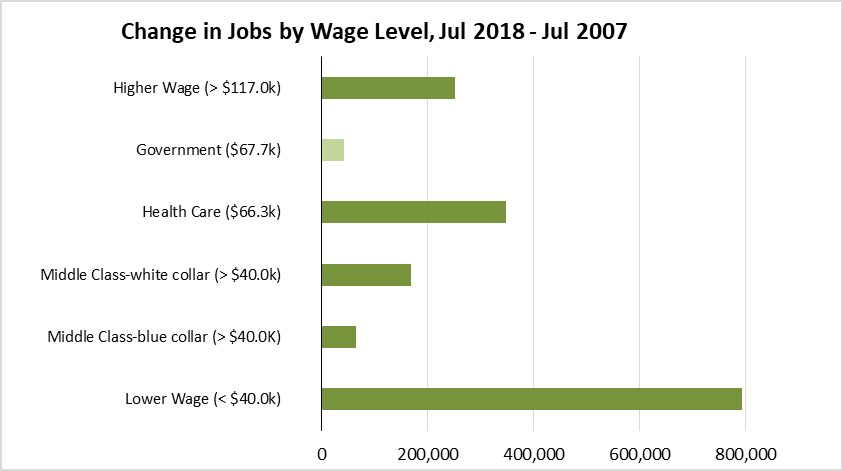
Job Gains by Wage Level
The following chart illustrates the trend for total wage and salary jobs by general wage level, according to the industry wage classification used previously in other Center analyses of this issue. As indicated, nearly half (48%) of net jobs growth since the recession has been in the lower wage industries. For the 12 months ending July 2018, lower wage industries accounted for over a quarter (28%) of new jobs, while middle class-blue collar jobs produced over a quarter (30%) as Construction levels remained higher compared to prior years.

Two-Tier Economy Persists—Central Valley Unemployment More than Twice as High as Bay Area
The level of unemployment rates (all data is not seasonally adjusted) continues to vary widely across the state, ranging from 2.9% in the Bay Area to more than twice as large at 7.4% in the Central Valley.
| Not Seasonally Adjusted | Unemployment Rate (%) July 2018 |
|---|---|
| California | 4.4 |
| Bay Area | 2.9 |
| Orange County | 3.2 |
| Sacramento | 3.9 |
| Central Sierra | 4.1 |
| San Diego/Imperial | 4.2 |
| Central Coast | 4.2 |
| Inland Empire | 4.6 |
| Los Angeles | 4.9 |
| Upstate California | 5.3 |
| Central Valley | 7.4 |
By Legislative District:
| Lowest 10 Unemployment Rates | |||||
|---|---|---|---|---|---|
| CD18 (Eshoo-D) | 2.2 | SD13 (Hill-D) | 2.1 | AD16 (Baker-R) | 2.1 |
| CD12 (Pelosi-D) | 2.3 | SD11 (Wiener-D) | 2.5 | AD22 (Mullin-D) | 2.1 |
| CD52 (Peters-D) | 2.6 | SD39 (Atkins-D) | 2.8 | AD24 (Berman-D) | 2.2 |
| CD17 (Khanna-D) | 2.6 | SD36 (Bates-R) | 2.8 | AD28 (Low-D) | 2.3 |
| CD14 (Speier-D) | 2.6 | SD37 (Moorlach-R) | 2.9 | AD17 (Chiu-D) | 2.4 |
| CD45 (Walters-R) | 2.7 | SD10 (Wieckowski-D) | 2.9 | AD77 (Maienschein-R) | 2.6 |
| CD15 (Swalwell-D) | 2.7 | SD07 (Glazer-D) | 2.9 | AD25 (Chu-D) | 2.6 |
| CD49 (Issa-R) | 2.8 | SD15 (Beall-D) | 2.9 | AD73 (Brough-R) | 2.6 |
| CD48 (Rohrabacher-R) | 3.0 | SD02 (McGuire-D) | 3.2 | AD19 (Ting-D) | 2.6 |
| CD02 (Huffman-D) | 3.0 | SD34 (Nguyen-R) | 3.4 | AD78 (Gloria-D) | 2.7 |
| Highest 10 Unemployment Rates | |||||
|---|---|---|---|---|---|
| CD29 (Cárdenas-D) | 5.7 | SD33 (Lara-D) | 5.7 | AD36 (Lackey-R) | 6.4 |
| CD43 (Waters-D) | 5.8 | SD24 (de León-D) | 5.7 | AD34 (Fong-R) | 6.4 |
| CD40 (Roybal-Allard-D) | 5.8 | SD08 (Berryhill-R) | 5.8 | AD59 (Jones-Sawyer-D) | 6.6 |
| CD10 (Denham-R) | 6.1 | SD30 (Mitchell-D) | 5.9 | AD13 (Eggman-D) | 6.6 |
| CD44 (Barragán-D) | 7.0 | SD05 (Galgiani-D) | 5.9 | AD64 (Gipson-D) | 7.2 |
| CD23 (McCarthy-R) | 7.1 | SD35 (Bradford-D) | 6.2 | AD21 (Gray-D) | 8.2 |
| CD22 (Nunes-R) | 7.2 | SD16 (Fuller-R) | 6.9 | AD31 (Arambula-D) | 8.5 |
| CD16 (Costa-D) | 8.2 | SD12 (Cannella-R) | 6.9 | AD26 (Mathis-R) | 9.0 |
| CD51 (Vargas-D) | 8.9 | SD40 (Hueso-D) | 7.5 | AD32 (Salas-D) | 9.8 |
| CD21 (Valadao-R) | 9.3 | SD14 (Vidak-R) | 10.1 | AD56 (Garcia-D) | 10.2 |
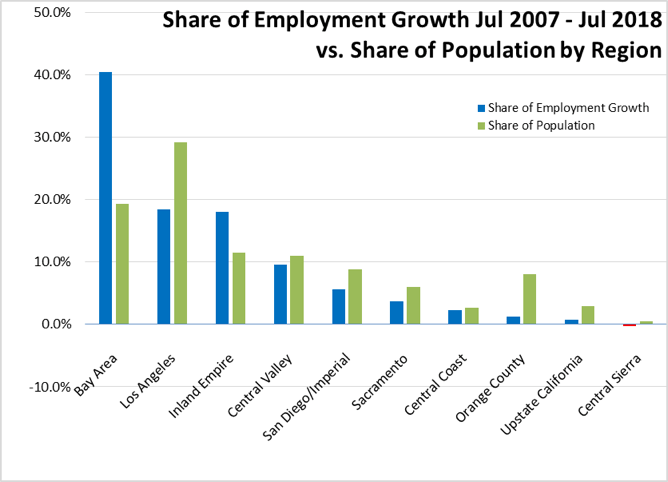
Bay Area Provided 40.4% of Net Employment Growth Since Recession
Containing 19.4% of the state’s population, the Bay Area was responsible for 40.4% of the net growth in employment since the pre-recession peaks in 2007. Los Angeles Region, containing 29.2% of the population, accounted for the second largest share at 18.5%. Inland Empire is the only other region—at a growing margin—continuing to show employment gains above their population share.
Nine California MSAs in the 10 Worst Unemployment Rates Nationally
According to BLS data, of the 10 Metropolitan Statistical Areas (MSAs) with the worst unemployment rates nationally, 9 are in California. Of the 20 worst, 10 are in California.
| Metropolitan Area | June 2018 Rate | Rank |
|---|---|---|
| Rocky Mount, NC Metropolitan Statistical Area | 6.3 | 368 |
| Vineland-Bridgeton, NJ Metropolitan Statistical Area | 6.3 | 368 |
| Beaumont-Port Arthur, TX Metropolitan Statistical Area | 6.4 | 371 |
| Stockton-Lodi, CA Metropolitan Statistical Area | 6.4 | 371 |
| Alexandria, LA Metropolitan Statistical Area | 6.5 | 373 |
| Shreveport-Bossier City, LA Metropolitan Statistical Area | 6.5 | 373 |
| Weirton-Steubenville, WV-OH Metropolitan Statistical Area | 6.7 | 375 |
| Hammond, LA Metropolitan Statistical Area | 6.8 | 376 |
| Brownsville-Harlingen, TX Metropolitan Statistical Area | 6.9 | 377 |
| McAllen-Edinburg-Mission, TX Metropolitan Statistical Area | 7.2 | 378 |
| Modesto, CA Metropolitan Statistical Area | 7.2 | 378 |
| Yuba City, CA Metropolitan Statistical Area | 7.3 | 380 |
| Madera, CA Metropolitan Statistical Area | 7.4 | 381 |
| Fresno, CA Metropolitan Statistical Area | 7.6 | 382 |
| Hanford-Corcoran, CA Metropolitan Statistical Area | 8.2 | 383 |
| Merced, CA Metropolitan Statistical Area | 8.6 | 384 |
| Bakersfield, CA Metropolitan Statistical Area | 8.7 | 385 |
| Visalia-Porterville, CA Metropolitan Statistical Area | 9.6 | 386 |
| El Centro, CA Metropolitan Statistical Area | 18.0 | 387 |
| Yuma, AZ Metropolitan Statistical Area | 19.1 | 388 |
Note: All data sources, methodologies, and historical data series available at CenterforJobs.org/ca.