Highlights for policy makers:
- COVID-19 and the State Economy
- Employment 1.170 Million Below Recovery
- Labor Force Participation Rate Unchanged
- Nonfarm Jobs: 1.308 Million Below Recovery
- Jobs Change by Industry
- Employment Recovery by Region
- Unemployment Rates by Legislative Districts
- Unemployment Rates by Region
- MSAs with the Worst Unemployment Rates
COVID-19 and the State Economy
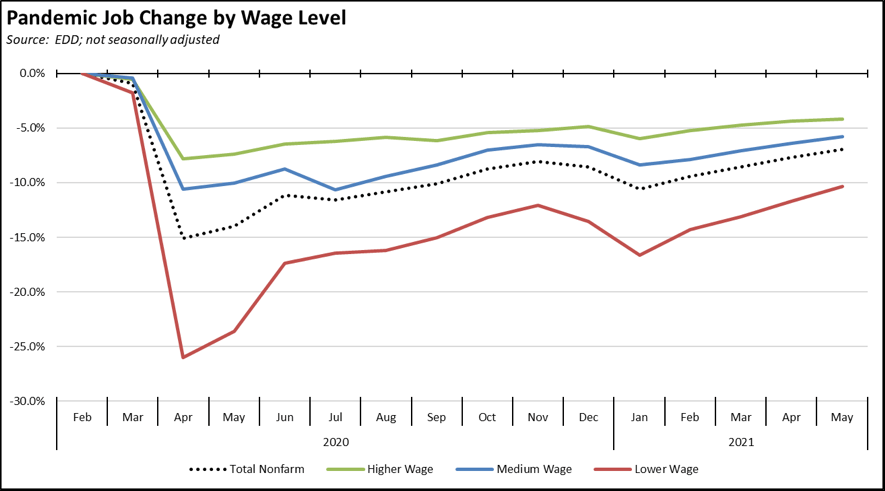
The May numbers reflect a period when most counties had moved out of the strictest, Tier 1 restrictions. Not surprisingly, as businesses were allowed to move towards more relaxed operating conditions, the job numbers came in higher than previous months. Gains in employment, however, remained subdued in the seasonally adjusted numbers but more in line with job changes in the more relevant unadjusted numbers.
Job gains were seen across all three wage levels. While the lower wage industries again experienced somewhat higher change, their overall recovery status remains the lowest. All wage levels remained above the previous recovery peak reached prior to the state’s renewed stay-at-home orders at the end of last year, regaining that lost economic ground and showing positive steps in recovery.
In the chart, higher wage jobs are those industries with average annual wages above $100,000; medium wage is $50,000 to $100,000; and lower wage is below $50,000. Job data is drawn from the industry classifications, unadjusted job numbers, and wage levels generally used in the regular report section below on Nonfarm Jobs.
COVID-Period Transfer Payments and the State’s Economy
Changes in labor force participation, however, remain stalled as many workers have chosen not to renew their jobs search yet. Obviously, there are many factors at play in this situation—notably including residual fears of catching COVID and actions, or more accurately inactions by state and local agencies that have kept California near the bottom of reopened schools—but the unprecedented level of federal and state benefits have contributed to what an increasing number of employers describe as a labor shortage as they struggle to reopen and/or restore their business activities. The most recent and current round on the federal level includes measures extended through the American Rescue Plan Act adopted in March, including an additional $300 per week for unemployment benefits (Federal Pandemic Unemployment Compensation), continued Pandemic Unemployment Assistance for the self-employed and others, Federal Emergency Unemployment Compensation providing for extended benefit payments, and several other smaller programs.
While these measures provide assistance to households dealing with state and local restrictions on their job opportunities both directly and through school closures, the high and sustained level of these benefits in essence have placed government in the role of bidding against employers for workers.
A number of studies have attempted to quantify the scale of this competition. Most of the debate has tended to focus solely on the amount provided through unemployment insurance, but workers drawing on those benefits also qualify for other assistance under the broader safety net, although even here the current level of unemployment payments disqualifies households from some of these other components. One recent study compared equivalent incomes to an hypothetical household of two workers and two children in each of the states. The analysis focuses on the enhanced unemployment payments but incorporates other benefits to which this household would be entitled, tax considerations (e.g., no payroll taxes), and other factors but does not include every factor such as the reduction in work-related expenses (e.g., commuting), some programs such as food stamps, and tax exemption for some of the unemployment payments.
For California, the calculated income equivalent for this household is $109,062 ($27 an hour) if it is assumed they receive the maximum amounts to which they would be entitled, and $65,187 ($16 an hour) if they receive only the average amounts. The average amount, however, is likely a more appropriate measure as research by both the Center and Congressional Budget Office indicate most households do not apply under all programs for which they would be eligible due to the complexity of the application and subsequent compliance provisions. Most, in fact, focus on only one. The recent experience of millions of California workers in attempting to secure their unemployment payments is a prime example in this regard.
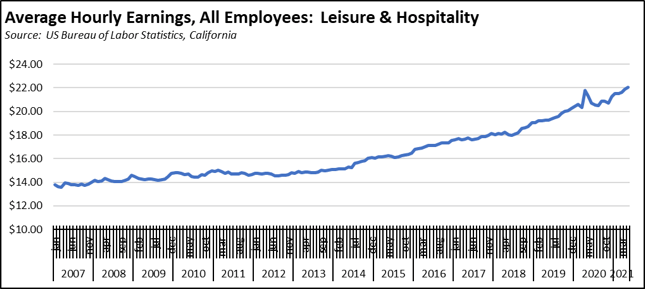
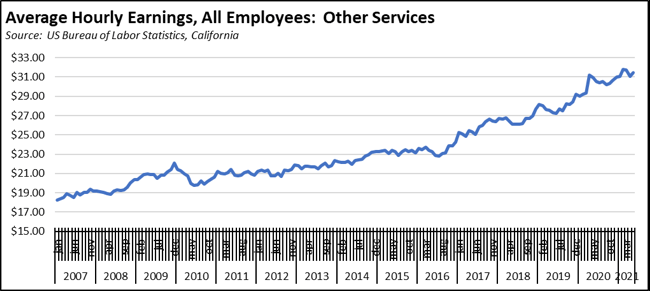
Wage levels in the state are rising in response to this labor shortage, as indicated in the charts showing average hourly wage in the state. Particularly for the two lower wage industries shown—Leisure & Hospitality and Other Services—wages were already rising prior to the pandemic period as the economy neared full employment in 2018 and 2019. The first three charts then indicate a sharper rise at the beginning of the pandemic resulting from a composition effect as lower wage, direct customer contact workers were laid off, but wages have since resumed rising as this composition effect has diminished. Manufacturing—which contains data for production workers rather than all workers as in the others—shows a sharp drop amid the 2020 supply disruptions, followed by a sharper rise in recent months as producers attempt to restore reliable supplies.
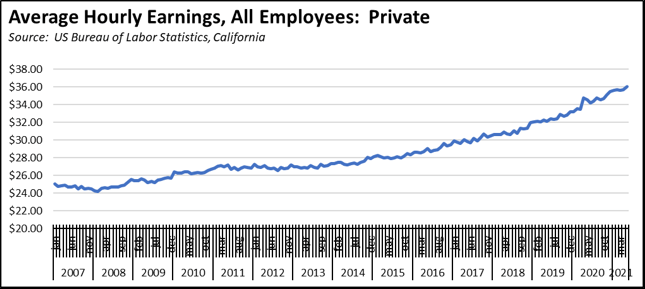
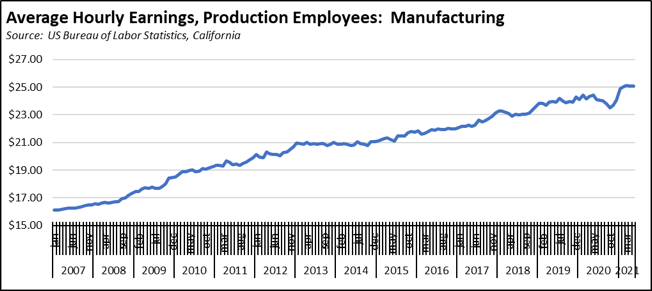
Many manufacturers in fact now indicate they are in competition with service industries in bidding for the available labor supply. This outcome is only one of a potential side effects in the current situation, in this case one leading to delays in manufacturing recovery, continued supply chain disruptions, and resulting contributions to inflationary pressures that could outstrip wage gains workers have been able to achieve.
Included in the nearly 400 program proposals of the May Budget Revise is $35 million to fund a pilot study of Universal Basic Income. From a broader policy perspective, such a pilot is already being done but through a much broader application under the expansion of unemployment benefits to the current unprecedented levels. While acknowledging the additional factors from the pandemic conditions, the policy lessons in regards to the effect on work and longer term unemployment effects on worker skill and wage potential are not that far afield from the results of similar large scale pilot projects conducted in the 1960s and 1970s along with similar recent efforts in Canada, Finland, and elsewhere. More selective, small scale efforts such as being proposed for the budget and as funded by other proponents are unlikely to replicate the conditions of this real-world pilot.
To date, 26 states have announced an early end to the enhanced unemployment benefits prior to their scheduled end in September, as shown in the following chart from Center for a Responsible Federal Budget. California instead has announced reinstatement of the work search requirement. These provisions will not go into effect into July 11, and will add further to the administrative workload of an agency already struggling with a substantial claims backlog, soaring call center delays, and large numbers of fraudulent claims.
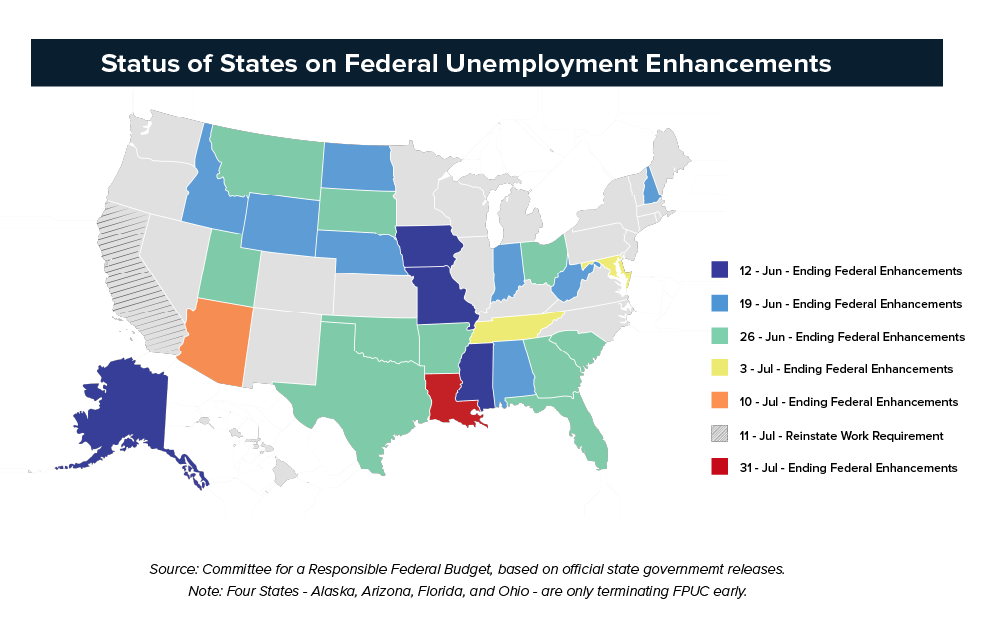
A comparison of these two approaches can be made from subsequent month’s employment reports, but not until the data to be released in August becomes available. Additional tracking such as through unemployment initial claims will instead be used for more immediate comparisons.
CaliFormer Businesses: Update
Additional CaliFormer companies identified since our last monthly report are as follows. These companies include those that have announced: (1) moving their headquarters or full operations out of state, (2) moving business units out of state (generally back office operations where the employees do not have to be in a more costly California location to do their jobs), (3) California companies that expanded out of state, and (4) companies turning to permanent telework options, leaving it to their employees to decide where to work and live.
| wdt_ID | Companies | From | To | Reason | Source | Year |
|---|---|---|---|---|---|---|
| 2 | Brightseed | San Francisco | North Carolina | Expansion | Read More | 2022 |
| 3 | ePost Global | Rancho Dominguez | Florida | Expansion | Read More | 2022 |
| 4 | LG Energy Solution | Torrance | Arizona | $1.4 billion battery manufacturing plant | Read More | 2022 |
| 5 | Lucid Motors | Newark | Arizona | Manufacturing expansion | Read More | 2022 |
| 6 | Salesforce | San Francisco | Atlanta | Shift of executive suite posts | Read More | 2022 |
| 7 | Sana Biotechnologies | Fremont | Washington | Manufacturing relocation | Read More | 2022 |
| 8 | Seed&Spark | Los Angeles | Atlanta | HQ move | Read More | 2022 |
| 9 | Sila Nanotechnologies | Alameda | Washington | Manufacturing expansion | Read More | 2022 |
| 10 | Smithfield Foods | Vernon | various | Close manufacturing and 1,800 jobs | Read More | 2022 |
| 11 | Trinity Financial Services | Newport | Florida | HQ move | Read More | 2022 |
| 12 | Valex | Ventura | Texas | Manufacturing expansion | Read More | 2022 |
| 13 | Venus Aerospace | Seal Beach | Houston | HQ move | Read More | 2022 |
| 14 | Viasat Inc. | Carlsbad | Arizona | Expansion | Read More | 2022 |
| 15 | Yield Engineering Systems | Fremont | Arizona | Manufacturing expansion | Read More | 2022 |
| Companies | From | To | Reason | Source | Year |
Employment 1.170 Million Below Recovery
EDD reported that employment (seasonally adjusted; May preliminary) grew 39,500 from the revised April numbers, while the number of unemployed dropped 27,100. The unadjusted numbers showed a stronger gain of 231,000 om the employment numbers after two months of declines.
The reported unemployment rate was 7.9%, down 0.1 point from the revised April number. California edged up to the 3rd worst unemployment rate in the country, behind only Hawaii and New Mexico.
Total US employment gained 444,000, while the number of unemployed dropped by 496,000. The reported unemployment rate dipped 0.3 point to 5.8%.
Figure Sources: California Employment Development Department; US Bureau of Labor Statistics
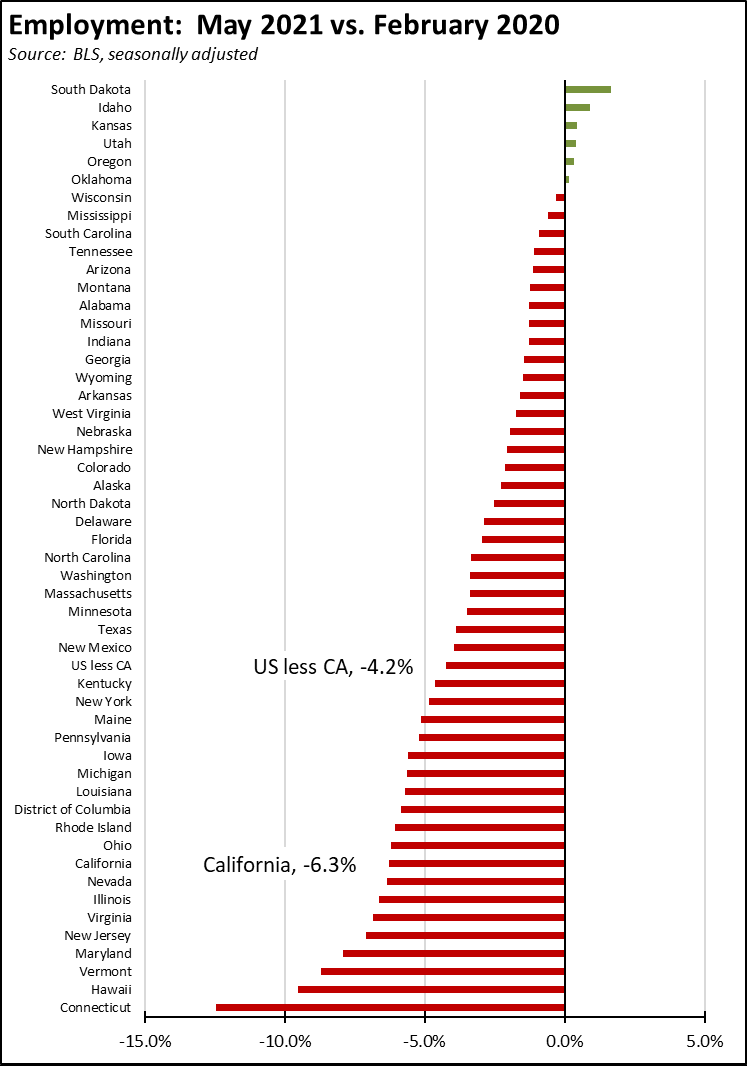
In the seasonally adjusted numbers, California employment remains 1.170 million (6.3%) below the pre-pandemic level in February 2020. Compared to the other states, California was the 9th lowest ranked by employment recovery level, while 6 states exceeded the pre-pandemic February 2020 employment levels.
In the more broadly defined U6 unemployment rate measure, California was also the 3rd highest in the first quarter of 2021, at 18.4% compared to 14.0% average for the rest of the states and DC. Only Hawaii and Nevada had higher rates.
Labor Force Participation Rate Unchanged
The labor force participation rate was unchanged at a revised 60.8%, while the US number dipped 0.1 point to 61.6%. The rate remains well below the pre-pandemic level of 62.5%, which in turn was down substantially from prior years. Taking into account the participation rate, California cannot be said to have fully recovered even prior to the pandemic shutdowns. The additional workers leaving the labor force in pandemic period puts that goal further off. Accounting for workers leaving the workforce since February 2020, there were 2.0 million unemployed in May.
Nonfarm Jobs: 1.308 Million Below Recovery
Nonfarm wage and salary jobs rose 104,500 (seasonally adjusted) in May, while there were only minor adjustments to the previous gains reported for April. Nonfarm jobs nationally were up 559,000.
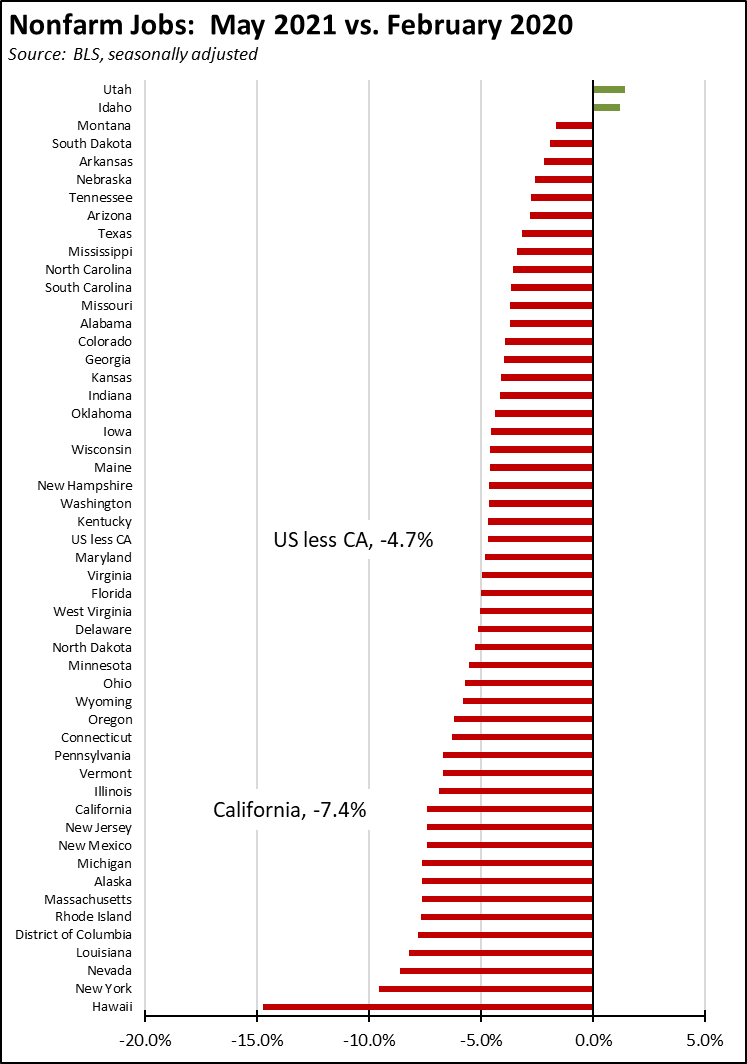
While job gains were stronger over the past three months, California came in 12th lowest based on jobs recovery. Compared to the February 2020 numbers (seasonally adjusted) just prior to the current crisis and not accounting for population changes, nonfarm wage and salary jobs in California 1.308 million short of recovery, or 17.1% of the national shortfall.
In the seasonally adjusted numbers, two states—Utah and Idaho—exceed the pre-pandemic levels, moving from recovery to growth. In the more relevant unadjusted numbers, two additional states—Montana and South Dakota—have also reached this stage.
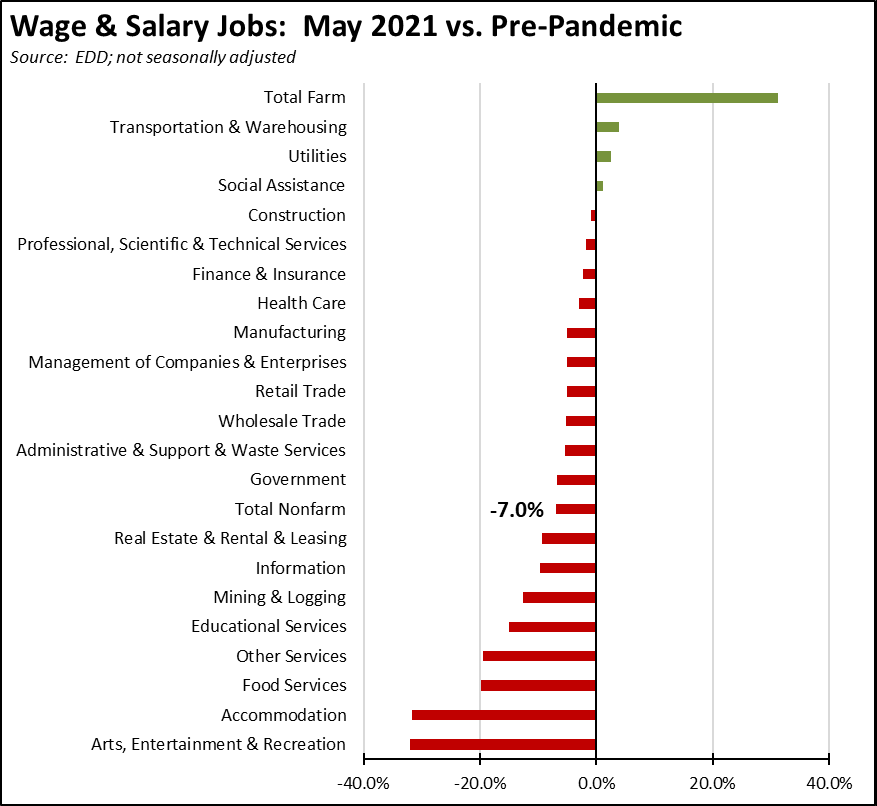
Jobs Change by Industry
Using the unadjusted numbers that allow a more detailed look at industry shifts, 4 industries showed job levels exceeding pre-pandemic February 2020 levels. Lower wage Accommodation, Food Services, and Other Services along with mid-wage Arts, Entertainment & Recreation continued to show the lowest levels of recovery, reflecting the continuation of the prior county tier restrictions prior to June 15.
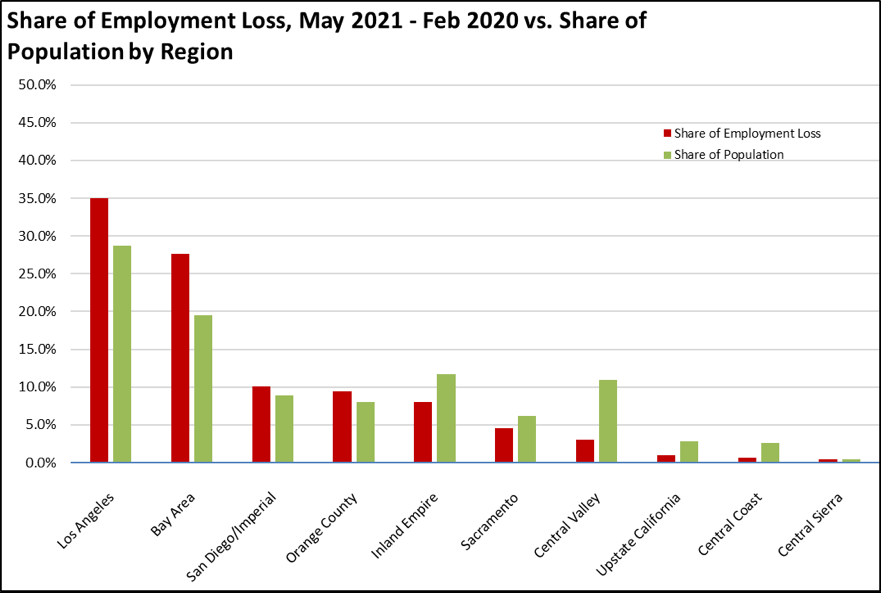
Employment Recovery by Region
All regions continued to show lower employment compared to pre-pandemic February 2020, with Los Angeles and Bay Area still showing the relatively highest losses.
Unemployment Rates by Legislative Districts
The highest and lowest estimated unemployment rates in May are shown below. The legislative district estimates have been updated to reflect both EDD’s revisions to the unemployment data and the most current factors from the American Community Survey.
Lowest
| wdt_ID | Congressional District | Unemployment Rate |
|---|---|---|
| 2 | CD18 (Eshoo-D) | 3.8 |
| 3 | CD17 (Khanna-D) | 4.6 |
| 4 | CD15 (Swalwell-D) | 5.0 |
| 5 | CD14 (Speier-D) | 5.0 |
| 6 | CD52 (Peters-D) | 4.9 |
| 7 | CD12 (Pelosi-D) | 4.9 |
| 9 | CD02 (Huffman-D) | 5.1 |
| 10 | CD49 (Levin-D) | 5.2 |
| 12 | CD24 (Carbajal-D) | 5.3 |
| 13 | CD45 (Porter-D) | 5.4 |
| wdt_ID | Senate District | Unemployment Rate |
|---|---|---|
| 2 | SD13 (Hill-D) | 4.2 |
| 3 | SD15 (Beall-D) | 4.8 |
| 4 | SD10 (Wieckowski-D) | 5.1 |
| 5 | SD39 (Atkins-D) | 5.1 |
| 6 | SD36 (Bates-R) | 5.2 |
| 7 | SD01 (Dahle-R) | 5.4 |
| 8 | SD11 (Wiener-D) | 5.2 |
| 9 | SD37 (Moorlach-R) | 5.4 |
| 10 | SD02 (McGuire-D) | 5.4 |
| 11 | SD07 (Glazer-D) | 5.9 |
| wdt_ID | Assembly District | Unemployment Rate |
|---|---|---|
| 2 | AD28 (Low-D) | 3.0 |
| 3 | AD24 (Berman-D) | 3.3 |
| 4 | AD22 (Mullin-D) | 3.3 |
| 5 | AD16 (Bauer-Kahan-D) | 3.6 |
| 6 | AD73 (Brough-R) | 4.0 |
| 7 | AD10 (Levine-D) | 4.0 |
| 8 | AD06 (Kiley-R) | 3.9 |
| 9 | AD25 (Chu-D) | 3.8 |
| 10 | AD17 (Chiu-D) | 3.8 |
| 11 | AD78 (Gloria-D) | 4.1 |
Highest
| wdt_ID | Congressional District | Unemployment Rate |
|---|---|---|
| 2 | CD29 (Cardenas-D) | 7.8 |
| 3 | CD37 (Bass-D) | 7.9 |
| 4 | CD28 (Schiff-D) | 8.0 |
| 5 | CD34 (Gomez-D) | 8.7 |
| 6 | CD16 (Costa-D) | 8.9 |
| 7 | CD32 (Napolitano-D) | 7.9 |
| 9 | CD21 (Cox-D) | 9.5 |
| 10 | CD40 (Roybal-Allard-D) | 9.5 |
| 12 | CD51 (Vargas-D) | 10.6 |
| 13 | CD44 (Barragan-D) | 10.6 |
| wdt_ID | Senate District | Unemployment Rate |
|---|---|---|
| 2 | SD22 (Rubio-D) | 7.1 |
| 3 | SD12 (Caballero-D) | 7.4 |
| 4 | SD21 (Wilk-R) | 8.5 |
| 5 | SD35 (Bradford-D) | 8.8 |
| 6 | SD24 (Durazo-D) | 8.8 |
| 7 | SD18 (Hertzberg-D) | 7.9 |
| 9 | SD30 (Mitchell-D) | 9.0 |
| 10 | SD33 (Gonzalez-D) | 9.1 |
| 12 | SD40 (Hueso-D) | 9.4 |
| 13 | SD14 (Hurtado-D) | 10.4 |
| wdt_ID | Assembly District | Unemployment Rate |
|---|---|---|
| 2 | AD46 (Nazarian-D) | 8.8 |
| 3 | AD31 (Arambula-D) | 9.3 |
| 4 | AD36 (Lackey-R) | 9.2 |
| 5 | AD63 (Rendon-D) | 9.8 |
| 6 | AD32 (Salas-D) | 9.6 |
| 7 | AD26 (Mathis-R) | 9.0 |
| 9 | AD51 (Carrillo-D) | 9.9 |
| 10 | AD64 (Gipson-D) | 10.3 |
| 12 | AD59 (Jones-Sawyer-D) | 10.4 |
| 13 | AD56 (Garcia-D) | 11.3 |
Unemployment Rates by Region
Unemployment rates (not seasonally adjusted) compared to pre-pandemic February 2020 continue to show the Los Angeles region with the worst outcome in the state.
| wdt_ID | Region | Apr - 21 | Feb - 20 |
|---|---|---|---|
| 2 | California | 7.5 | 4.3 |
| 6 | Bay Area | 5.4 | 2.7 |
| 10 | Orange County | 5.9 | 7.0 |
| 14 | Sacramento | 6.2 | 4.5 |
| 18 | Central Sierra | 6.3 | 8.4 |
| 22 | Central Coast | 6.6 | 4.6 |
| 26 | San Diego/Imperial | 6.8 | 3.9 |
| 30 | Upstate California | 6.9 | 2.8 |
| 34 | Inland Empire | 7.2 | 3.7 |
| 38 | Central Valley | 9.1 | 3.8 |
| 39 | Los Angeles | 9.7 | 6.3 |
Figure Source: California Employment Development Department
MSAs with the Worst Unemployment Rates
California had 12 of the MSAs among the 25 regions with the worst unemployment rates in April.
| wdt_ID | MSA | February Unemployment Rate | US Rank out of 389 |
|---|---|---|---|
| 1 | El Centro MSA | 16.1 | 389 |
| 2 | Visalia-Porterville MSA | 11.0 | 385 |
| 3 | Merced MSA | 10.9 | 384 |
| 4 | Bakersfield MSA | 10.7 | 383 |
| 5 | Hanford-Corcoran MSA | 10.2 | 381 |
| 6 | Los Angeles-Long Beach-Anaheim MSA | 9.9 | 377 |
| 7 | Fresno MSA | 9.6 | 375 |
| 8 | Madera MSA | 9.5 | 374 |
| 9 | Yuba City MSA | 9.4 | 373 |
| 10 | Stockton-Lodi MSA | 9.0 | 369 |
| 11 | Salinas MSA | 8.6 | 365 |
| 12 | Modesto MSA | 8.6 | 365 |