Highlights for policy makers:
- COVID-19 and the State Economy
- CaliFormer Businesses: Update
- CaliFormers: Migration Data—Tax Flows Out of the State More than Double in 2020
- NonFarm Jobs: 194k Below Pre-Covid Peak
- Job Change by Industry
- Employment 265k Below Pre-Covid Level
- Labor Force Participation Rate
- Unemployment Rates by Legislative Districts
- Unemployment Rates by Region
- Employment Recovery by Region
- MSAs with the Worst Unemployment Rates
COVID-19 and the State Economy
The numbers for May show continued progress towards recovery to the pre-pandemic peaks, but with the size of employment gains weakening since March and nonfarm job gains weakening since February. California at 42,900 more nonfarm jobs in May came in second behind Texas (74,200) for the second month in a row.
With the May numbers, California employment was still 264,700 short of the pre-pandemic level in February 2020, while 31 other states were above this recovery metric. In nonfarm jobs, California was still 193,800 below the pre-pandemic peak, while 14 other states again came in above this level.
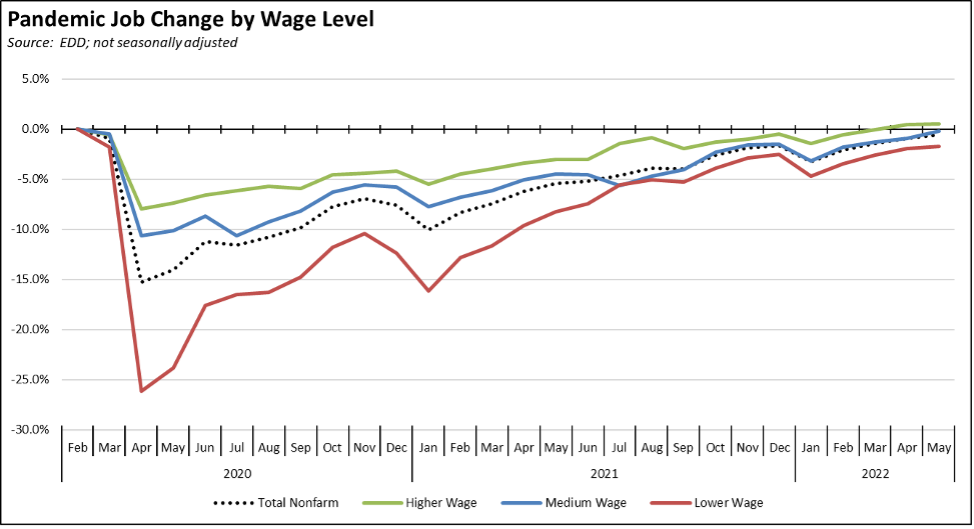
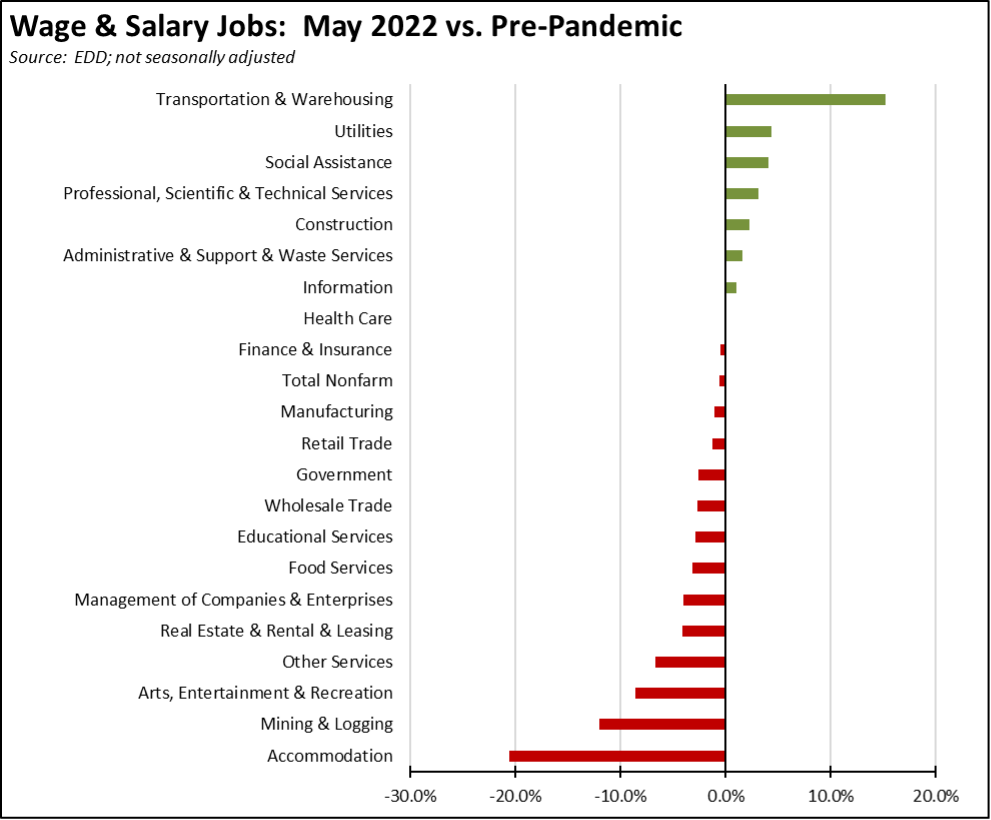
Using the unadjusted numbers to show results by average wage level, the higher wage industries remained in positive territory, while the medium wage industries were just 0.2% short. Lower wage industries while improving with seasonal hiring underway, still lagged the most.
The slowing pace of California’s steps towards recovery again raises the question of whether the state will be able to return to its prior peaks before the next economic downturn arrives. In addition to the more macro issues represented by growing inflation, rising energy costs continued supply disruptions, and the effect on consumption coming from wealth destruction in the stock, bond, and crypto markets, there are also indications that factors unique to the state may be weakening as well.
Labor supply remains a concern throughout the country but appears to be rising as a constraint on California’s recovery potential let alone its long-term growth prospects. Based on the JOLTS (job openings and labor turnover survey) data, California has shown over 1 million unfilled job openings at the end of each month since last June, rising to 1.3 million in the latest results from March. This demand has brought workers back into the labor force, but not in sufficient numbers and with sufficient skills to improve the overall recovery rate or to keep the jobs backlog from growing. The number of job openings per unemployed worker was largely stable between September and January at an average of 1.0 job openings per unemployed worker but then began rising sharply to 1.4 job openings per unemployed in the subsequent two months.
And job openings are no longer growing just because businesses are seeking to reopen and expand faster than the available labor. Beginning with the second reopening of the state in January 2021, the job numbers grew because employers were hiring more workers than those leaving either because they quit or as the result of layoffs/terminations. In two of the last three JOLTS data months, however, this situation reversed, with total separations exceeding total hires. The differences are small to date, but they give the first indications that a long-term hiring run is now coming up against skills and/or availability constraints.
California’s labor force has been growing, but still falls short of the pre-pandemic level in February 2020. The labor force participation rate has shown faster improvement in recent months to May’s 62.3% matching the national rate, but still is below the pre-pandemic 62.8% mark and is even further away from recovering to the 65.8% level reached prior to the Great Recession. More importantly, improvement in the participation rate has not just come from a growing labor supply—the state’s shrinking population has had an effect as well by shrinking the base used to calculate the rate.
Other states, especially those with lower costs of living, have seen their labor supply expand. Comparing the top 10 states with nonfarm jobs now above the pre-pandemic peak, their shift from recovery to job expansion has been made possible by a growing labor supply. In contrast, California’s continued recovery lag in part remains due to its policy emphasis on expanding benefits rather than expanding jobs and the skills of workers required to fill them. The labor force remains short of where it needs to be in order to support recovery, and well short of where it needs to move in order to promote job growth beyond that point.
Rising Costs of Living are now a national concern as the result of growing inflation. This issue, however, is not new to California as the costs of living were already pushed to crisis levels for many households over the past decade as the result of regulations and the state’s reliance on a high tax and fee model. As a result, an increasing number no longer view the state as a land of opportunity, but as the state increasingly divided along rigid economic lines. In a May 2022 Public Policy Institute of California poll, 71% of adults indicated they agreed with the statement that California is divided into economic groups, the haves, and the have-nots, up from 56% in January 1999. More critically for the state’s future progress, 45% believed they were in the “have-nots”, up from a low of 32% in September 2002.
Having to finally deal with the cost-of-living crisis due to the sudden recent rise in prices, California along with the federal government as usual has turned to proposals to provide assistance that generally is temporary in nature and by this nature capable of addressing only a portion of the current economic harm and only a portion of the households and employers being affected. While well-intentioned, these proposals only would provide partial amelioration of the harm rather than more fundamental reforms that would get at the root causes. And even as proposals are now being generated to offset the rising costs of fuels, housing, utilities, and other essential goods and services caused by past regulations, the state agencies continue to work on yet additional rounds of rules that will raise them even higher in the future such as the Air Resources Board Scoping Plan and associated rulemakings.
In another example of long-term increases working against current short-term fixes, the current budget documents contain components for tax relief to some households to offset fuel costs and to some employers to offset the higher costs of operating in the state. Yet at the same time, the legislature has so far seen proposals in the second year of the current session to increase taxes and fees by $194.62 billion. The ongoing failure to address the state’s federal unemployment insurance fund debt is resulting in tax increases on employers that will dwarf the current efforts for tax assistance. California’s already highest-in-the-nation gasoline taxes are set to increase by another 2.8 cents per gallon on July 1. Still other state and local tax increases are now headed to the November ballot.
In contrast, other states are reducing tax rates in order to become more competitive and increase disposable incomes, a more effective offset to inflation since households tend to make decisions from long-term income expectations rather than more temporary bumps as embodied in most current proposals to do so through one time, directed benefits. Using Tax Foundation information, 23 states have reduced their top personal income tax rate between 2013 and 2022, while only 7 have raised it (7 have no personal income tax and Washington just recently added a tax but applied only to capital gains). For corporate income tax, 21 states have reduced their top rate in an effort to become more competitive for investment and jobs, and only 2 have raised it (6 have no corporate income tax).
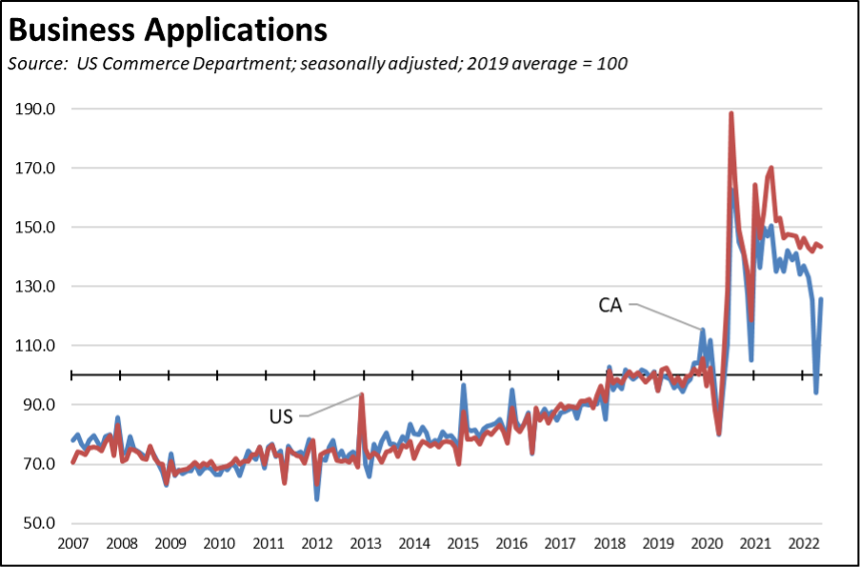
Business Formations saw a jump during the pandemic period as workers sought employment alternatives and as workers acted on their preferences to be their own boss and build a base providing economic mobility for their families. This second aspect in particular was a preferred economic mobility strategy cited frequently by lower-income workers covered in our detailed research of the working poor and the circumstances and opportunities they face in California.
But after largely tracking with the US numbers both before and during the pandemic period, new business applications in California have diverged into a sustained downward trend in recent months. This drop likely reflects a confluence of factors including the state’s higher operating costs and regulations—including the governor’s recent announcement of yet another likely increase in the minimum wage—along with other only-in-California restrictions such as on independent contracting through AB 5 and uncertainties being generated over many business opportunities by the current Air Resources Board Scoping Plan process and associated rulemakings. This trend suggests that the start-up culture on which the state has long relied both for current employment and for future jobs as new businesses grow into large ones is beginning to move elsewhere.
Tax Base risks appear to be growing to the two foundational components of the state’s volatile tax structure, capital gains in general and the Bay Area as the dominant revenue source specifically.
The current sharp drops in the stock and crypto markets are weakening capital gains on two fronts. Both the duration and extent of the current market downturns are likely to result in sharply lower gains directly in the current tax year. Indirectly, market losses are curtailing potential IPO valuations and consequently overall IPO activity along with capital available for acquisitions.
The latest monthly cash flow results from the State Controller’s office suggest a slowdown may already be happening. The current unprecedented surpluses experienced by the state over the past two years came as the effects of the state-ordered shutdowns were felt hardest by lower-income workers and direct customer contact businesses. The higher income portions of the economy were largely untouched due to the rapid shift to telework and other operational shifts, a booming stock market, and high levels of IPO activity throughout this period.
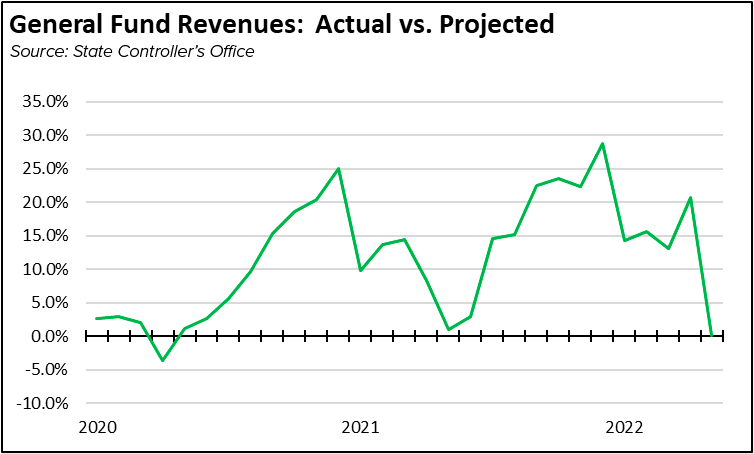
The surpluses came as the budget’s general fund projections throughout this period severely underestimated the scale of these effects. As reported in the State Controller (preliminary) cash flow reports, the various projections began this undercount as soon as the 2019 May Revisions were completed, reaching a low point in May 2020 when actual fiscal year-to-date revenues were 1% greater than projected revenues, and a high of 28.8% in December 2021 as income was shifted into 2021 over concerns of potential federal tax increases this year. Note that the projection base changed throughout this period as projections were released in the January Proposed Budget, May Revisions, and final numbers in the Budget Bill, but all with numbers that quickly fell behind what was happening in the economy.
The May 2022 cash flow report is the first instance since the beginning of the pandemic when actual revenues essentially match projected, differing only by 0.1%. While the projections overall may have become better at capturing the various components as discussed above, this sudden shift also suggests that revenue surprises to the upside may be coming to a quick end.
While the capital gain results basically determine whether the budget will be in surplus or deficit in any given fiscal year, a more critical issue is the growing overreliance on the results coming from the Bay Area economy. In the latest 2020 tax year results from Franchise Tax Board, the amount of personal income tax (PIT) revenues—which account for about two-thirds of total general fund revenues—produced from the Bay Area reached 43.2%. As indicated in the chart below, this outcome results from two factors: (1) Bay Area incomes overall have trended higher, producing 34.7% of total state AGI (adjusted gross income) in 2020 from 19.6% of the state’s population, and (2) the incidence of high-income returns is much higher as well, resulting in more taxpayers paying tax at the higher state tax rates.
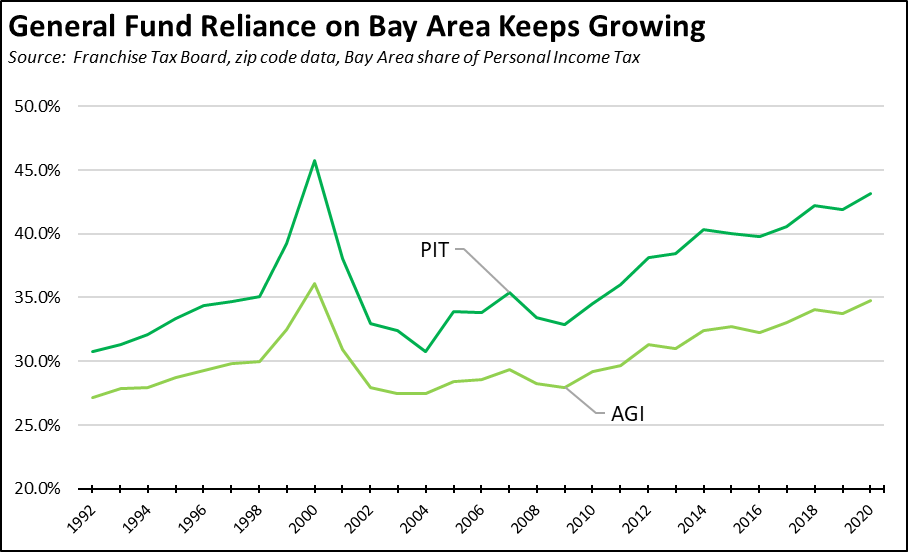
The 2020 share is just below the previous high of 45.7% paid by the Bay Area just prior to the Dot-Com crash. These surging revenues then backed a 17% jump in general fund spending in 2000-01. But with the quick reversal in the Bay Area tax receipts, the 2001-02 Proposed Budget calling for another spending increase of 6.2% turned into a shortfall of 12.0% composed of 7.4% in cuts and 4.5% in deficit spending when the actual revenue results came in.
There are no indications now that the Bay Area’s oversized role in supporting the state budget will diminish substantially as it did two decades ago. But there are suggestions that growth is slowing down. In the revised population estimates discussed in last month’s report, the Bay Area had the second highest population loss rate between 2020 and 2022, losing 1.7% of its population compared to the statewide average of 1.5%. Reported job losses in the tech industry continue to affect smaller and startup players more than the major players, but the latest tracking indicates that 21% of the known 21,535 layoffs to date in 2022 have been in California including the recent announcement from Coinbase (San Francisco) that it would lay off 1,100 workers and begin consideration of restructuring options. A number of the majors including Microsoft’s Meta Platforms, Twitter, and Facebook instead have announced hiring freezes.
History may not always repeat itself, but the state budget is rebuilding the circumstances of expanding expenditures based on a narrow revenue base to test that theory.
CaliFormer Businesses: Update
Additional CaliFormer companies identified since our last monthly report are shown below. Companies listed below include those that have announced: (1) moving their headquarters or full operations out of state, (2) moving business units out of state (generally back office operations where the employees do not have to be in a more costly California location to do their jobs), (3) California companies that expanded out of state, and (4) companies turning to permanent telework options, leaving it to their employees to decide where to work and live. The list is not exhaustive but is drawn from a monthly search of sources in key cities.
While companies moving operations out of the state generally refrain from specifying why they are doing it, an increasing number recently has begun giving details on the high costs of doing business in the state that has caused these moves. Smithfield Foods which just announced the closure of its Vernon plant along with the loss of 1,800 manufacturing jobs listed several factors leading to this decision including:
. . . higher taxes, utility costs and labor costs in the state compared with other areas where it operates. . . In California, the cost of utilities is 3.5 times higher per head to produce pork compared with the 45 other U.S. plants Smithfield operates, a company spokesman said.
Sana Biotechnology in announcing the move of its Fremont production operations stated it “. . . expects the move to save the biotech more than $100 million over the next three years” due to lower operating costs.
| wdt_ID | Companies | From | To | Reason | Source | Year |
|---|---|---|---|---|---|---|
| 2 | Brightseed | San Francisco | North Carolina | Expansion | Read More | 2022 |
| 3 | ePost Global | Rancho Dominguez | Florida | Expansion | Read More | 2022 |
| 4 | LG Energy Solution | Torrance | Arizona | $1.4 billion battery manufacturing plant | Read More | 2022 |
| 5 | Lucid Motors | Newark | Arizona | Manufacturing expansion | Read More | 2022 |
| 6 | Salesforce | San Francisco | Atlanta | Shift of executive suite posts | Read More | 2022 |
| 7 | Sana Biotechnologies | Fremont | Washington | Manufacturing relocation | Read More | 2022 |
| 8 | Seed&Spark | Los Angeles | Atlanta | HQ move | Read More | 2022 |
| 9 | Sila Nanotechnologies | Alameda | Washington | Manufacturing expansion | Read More | 2022 |
| 10 | Smithfield Foods | Vernon | various | Close manufacturing and 1,800 jobs | Read More | 2022 |
| 11 | Trinity Financial Services | Newport | Florida | HQ move | Read More | 2022 |
| 12 | Valex | Ventura | Texas | Manufacturing expansion | Read More | 2022 |
| 13 | Venus Aerospace | Seal Beach | Houston | HQ move | Read More | 2022 |
| 14 | Viasat Inc. | Carlsbad | Arizona | Expansion | Read More | 2022 |
| 15 | Yield Engineering Systems | Fremont | Arizona | Manufacturing expansion | Read More | 2022 |
| Companies | From | To | Reason | Source | Year |
CaliFormers: Migration Data—Tax Flows Out of the State More than Double in 2020
The IRS release of tax return migration data for the tax year 2020 provides some of the first substantive information on migration during the pandemic period, compensating for weaknesses in the American Community Survey results for that year due to statistically inadequate response rates. While previous analyses of what was once termed the “California Exodus” have relied primarily on Post Office change-of-address information, the IRS results provide more detail on the flows of tax filers in and out of the state during this period, both by age and by income.
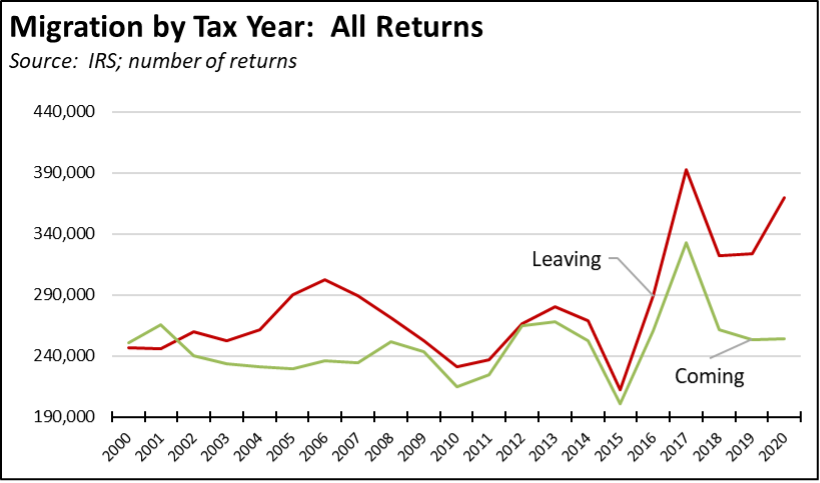
Overall, migration out of the state was up significantly in the first year of the pandemic. The number of tax filers leaving the state rose 14.2% to 370,083, accounting for 684,935 persons who moved to other states and nations. The level of migration was just short of the high previously reached in 2017 when housing prices essentially recovered in California and made these moves more economic after nine years of waiting for a larger number of households.
While the number of households leaving the state has been greater than those moving in since 2002, the gap widened substantially in 2020. The numbers for those moving into California were little changed from the prior two years and were down substantially from the previous high also reached in 2017. In all, net migration out of the state in 2020 reached a new high of 116,376 tax filers, accounting for a net total of 261,273 persons. As with all other IRS data, the numbers only cover households filing an income tax return for 2020.
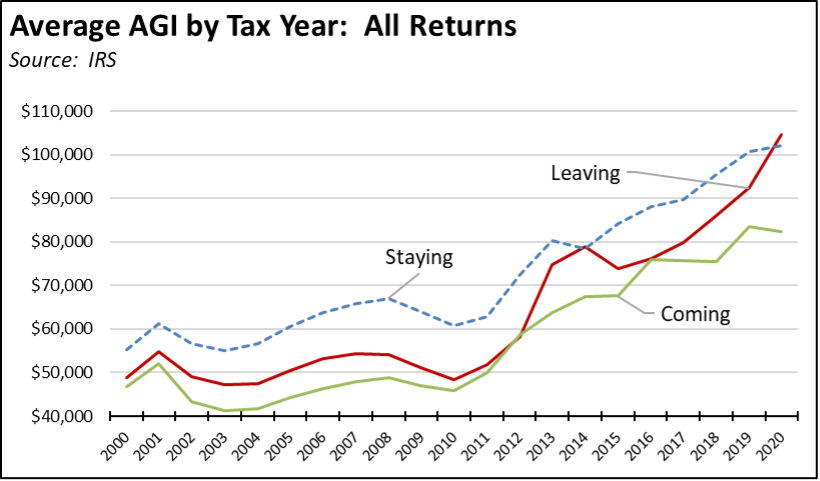
Gaps in income levels were even more substantial. Average household income (as measured by AGI—adjusted gross income) generally has been higher for those leaving the state than for those moving in, but the differences in most years have been relatively small. In 2020, the gap grew much wider, with the average AGI for households moving away also exceeding for the first time the average for those staying in California. In 2020, the average AGI was $104,600 for those leaving, $102,000 for those not moving, and $82,400 for those moving in.
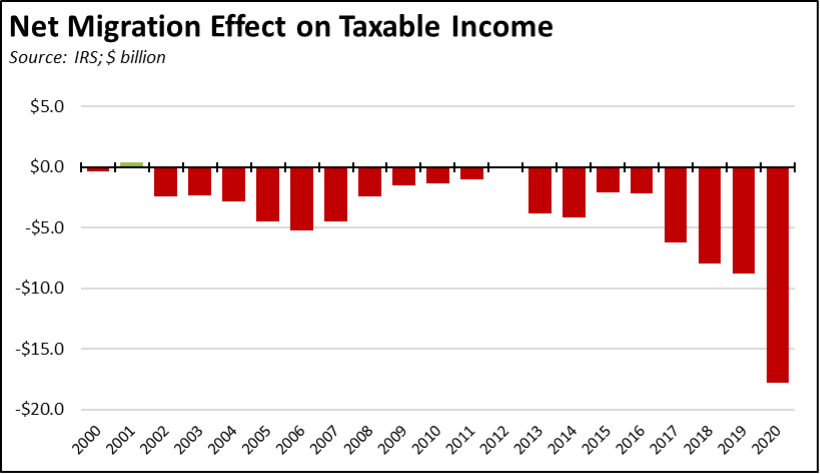
As a result of this growing trend for higher-income households, the net tax base loss to the state also has been rising. The net household income loss rose to $17.8 billion in 2020, or just more than double the previous record loss in 2019.
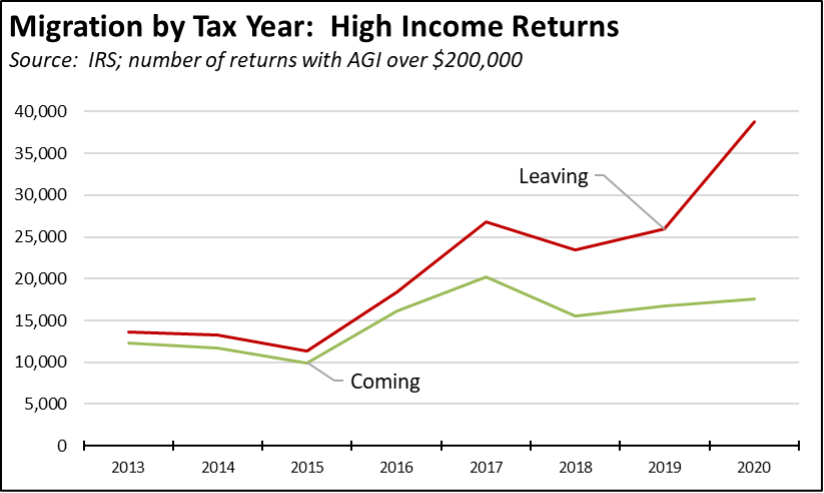
Looking only at higher income households—those with an AGI of $200,000 or more—the losses were more significant. In all, 38,751 tax filers (up 49.5% from 2019) with an average AGI of $548,800 left the state in 2020, while only 17,522 (up 4.5%) with an average AGI of $504,700 moved in. The significance of these numbers lies both in the substantial upward trend shown in the chart below, and in the fact that these households pay a much larger share of their income in taxes due to the structure of the state’s system.
Migration was up significantly in 2020—both in total numbers and the number of higher income households leaving the state—but it is important to note that these results came in the first year of the pandemic when moves of this or any other type faced unprecedented challenges. Even prior to the pandemic, rising costs of living in California were already causing increasing numbers to consider moving to other states. In a September 2019 Berkeley IGS Poll, 52% of registered voters indicated they were giving consideration (24% serious consideration) to moving out of California. African Americans were the highest reported group at 58%.
Rising costs of living were the two most often cited reasons for those considering a move, with 71% saying high housing costs and 58% high taxes. The costs of living in California have since continued to soar unchecked. The difficulties associated with moving during the pandemic are coming down. The true nature and scope of a “California Exodus” remain to be seen.
NonFarm Jobs: 194k Below Pre-Covid Peak
Nonfarm wage and salary jobs were up 42,900 (seasonally adjusted) in May, while gains in April were revised to 44,600 from the previously reported 41,400.
California showed the second highest monthly increase, behind Texas at 74,200. The number of states above the February 2020 pre-pandemic peak was unchanged at 14. California remains 193,800 below the prior peak or 23.6% of the remaining national shortfall.
Job Change by Industry
Using the unadjusted numbers that allow a more detailed look at industry shifts, the number of industries showed job levels at or exceeding the pre-pandemic February 2020 levels remained at 8. Transportation & Warehousing again showed the strongest growth by a large margin, with job growth greater than the next 4 industries combined. The biggest lags in recovery continue to be the lower-wage industries that were hardest hit by the state-ordered closures along with Mining & Logging that is being targeted for job losses under current state policies.
Employment 265k Below Pre-Covid Level
EDD reported that employment (seasonally adjusted; May preliminary) was up 121,000 from the revised April numbers. The number of unemployed was down by 45,900.
The reported unemployment rate improved by 0.3 point to 4.3%, compared to the revised 4.1% in February 2020 prior to the pandemic. California tied with Michigan for the 9th highest unemployment rate among the states. California contained 14.0% of the total number of unemployed workers in the US.
In the national numbers, total US employment was up 321,000, and the number of unemployed was largely unchanged, notching up 9,000. The reported unemployment rate was unchanged at 3.6% for the third month in a row, just above the 3.5% rate recorded in February 2020.
Figure Sources: California Employment Development Department; US Bureau of Labor Statistics
In the seasonally adjusted numbers, California employment remains 264,700 (1.4%) below the pre-pandemic level in February 2020; the US as a whole was only 0.3% below.
Labor Force Participation Rate
The labor force participation rate rose 0.2 point to 62.3%, while the US number was up 0.1 point to 62.3% as well. The California rate remains well below the pre-pandemic level of 62.8%, which in turn was down substantially from prior years. Accounting for workers leaving the workforce since February 2020, there were an estimated 1.0 million out of work in May.
Unemployment Rates by Legislative Districts
The highest and lowest estimated unemployment rates in May are shown below. The estimates are for the current, 2012 vintage districts. Estimates for the new districts under 2022 redistricting will be released after the required factors from the American Community Survey become available at the end of the year.
Lowest
Highest
Unemployment Rates by Region
Unemployment rates (not seasonally adjusted) compared to pre-pandemic February 2020 are shown below.
Figure Source: California Employment Development Department
Employment Recovery by Region
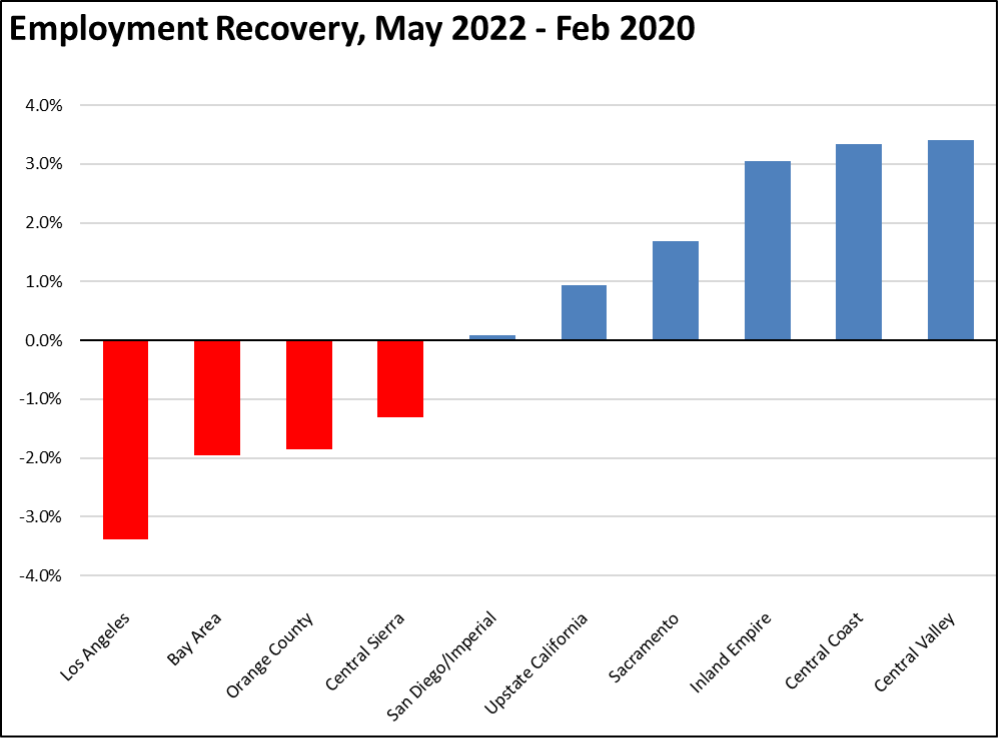
With San Diego/Imperial moving into positive territory, Los Angeles, Bay Area, and Orange County continue to lag the rest of the state in recovery to the pre-pandemic peak employment levels.
MSAs with the Worst Unemployment Rates
California went from 11 to 9 of the MSAs among the 25 regions with the worst unemployment rates in April, including El Centro MSA (Imperial County) with the second worst unemployment rate in the nation. Los Angeles-Long Beach-Anaheim MSA remained out of this group but dropped to #322 in a tie with 5 other MSAs in other states. The best performing California urban region was again San Jose-Sunnyvale-Santa Clara MSA, dropping to a tie with 15 other MSAs at #51, with an unemployment rate of 2.2% compared to the best performing regions, Mankato-North Mankato, MN and Rochester, MN MSAs at 1.3%.