Highlights for policy makers:
- COVID-19 and the State Economy
- CaliFormer Businesses: Update
- Employment 948k Below Recovery
- Labor Force Participation Rate
- Nonfarm Jobs: 886k Below Recovery
- Jobs Change by Industry
- Employment Recovery by Region
- Unemployment Rates by Legislative Districts
- Unemployment Rates by Region
- MSAs with the Worst Unemployment Rates
COVID-19 and the State Economy
The overall results for October again show the disconnect between the recovery of jobs lost during the pandemic and workers returning to the workforce. The change in nonfarm jobs (96,800) was 16% above average so far this year; employment gains (32,700) were less than half. The improvement in the October jobs number was to be expected, as it was the first full month of jobs data following the expiration of enhanced federal unemployment insurance benefits. However, a closer look at the data shows that overall labor force participation was little changed. Meanwhile, inflation continues to erode the substantial hourly wage gains that typically entice workers back into the workforce.
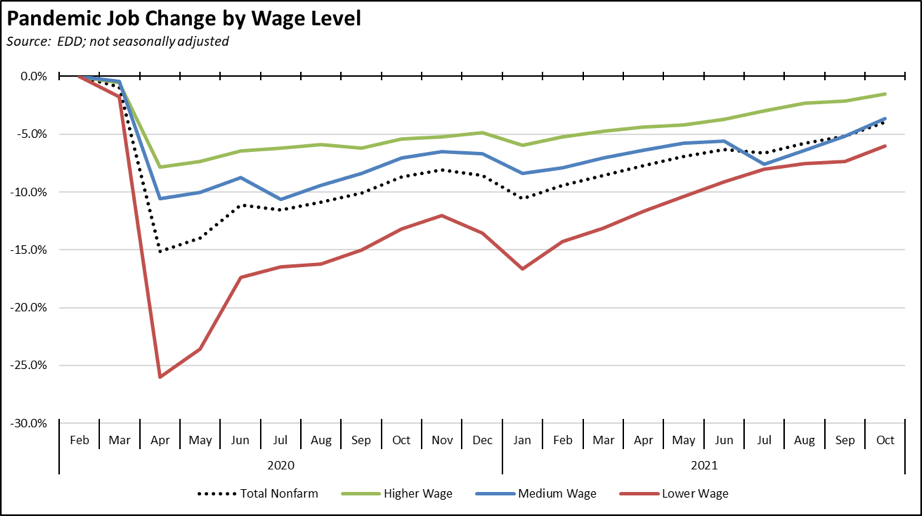
Using the more relevant unadjusted numbers, jobs by wage level showed improvement across all categories. Gains were again strongest within the medium wage industries, but just under half the gain came from Government and another quarter from Educational Services as schools continued to open. Higher wage industries came in only 1.5% below the pre-pandemic level in February 2020, while gains within the lower wage industries improved over the weaker performance in the prior two months.
In the chart below, higher wage jobs are those industries with average annual wages above $100,000; medium wage is $50,000 to $100,000; and lower wage is below $50,000. Job data is drawn from the industry classifications, unadjusted job numbers, and wage levels generally used in the report section below on Nonfarm Jobs.
Full Recovery Likely Not Until End of 2023
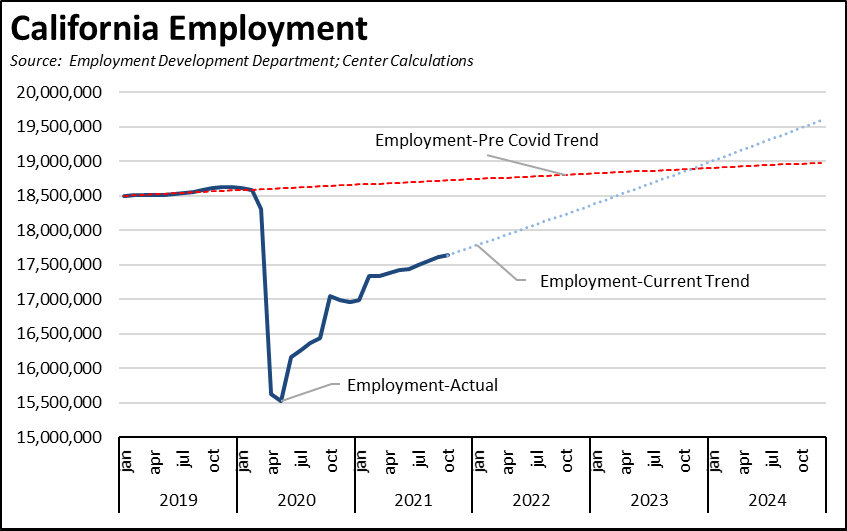
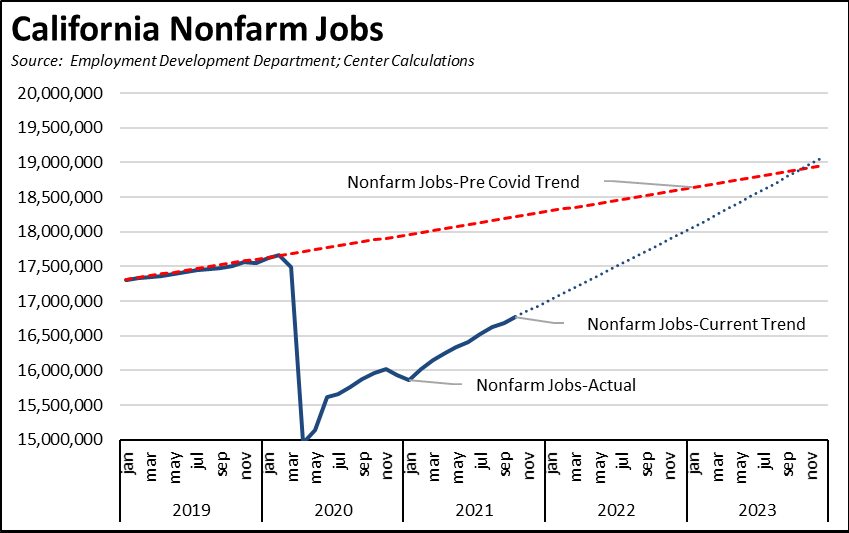
While most of the comparisons in this report and elsewhere measure recovery in terms of the pre-COVID levels in February 2020, the state lockdowns also shut off what was relatively strong growth in 2019. Full recovery consequently should instead be considered in how long it will take for the state to return to trend. Continuing the somewhat lower recovery rates experienced over the past three months would push back a return to the pre-Covid trend levels to the end of 2023.
In both charts, the pre-Covid trend is taken from the average monthly growth rate between January 2019 and February 2020. The Current Trend lines are calculated using the numbers from the last three months.
The prospects for accelerated gains or even continuance at current levels remain unclear. As detailed in prior Center reports, the current supply chain blockages remain a constraint on jobs growth both due to shortages and rising prices. While shipping for holiday sales is nearing an end, these blockages will continue to affect the availability of materials, components, and inventory in the months following due to more structural issues related to overall capacity and flexibility within the current system. Barring further actions to deal with these challenges, the system also remains vulnerable to new stoppages due to ongoing COVID risks.
Other shortages—including labor—remain a constraint on how quickly jobs can be filled. On the national level, the most recent surveys from NFIB indicate strong hiring plans by small businesses, but with a net 49% (all numbers are net of those indicating yes on the issue vs. no) reporting job openings they could not fill in the reporting period. As a consequence, an all-time high of a net 44% reported raising compensation. At the same time, equally all-time highs of a net 53% reported already raising prices in the current period and 51% planning on higher prices in the next three months. Wages and compensation are growing, but the broader cost pressures on businesses are contributing to the current inflation eroding these gains.
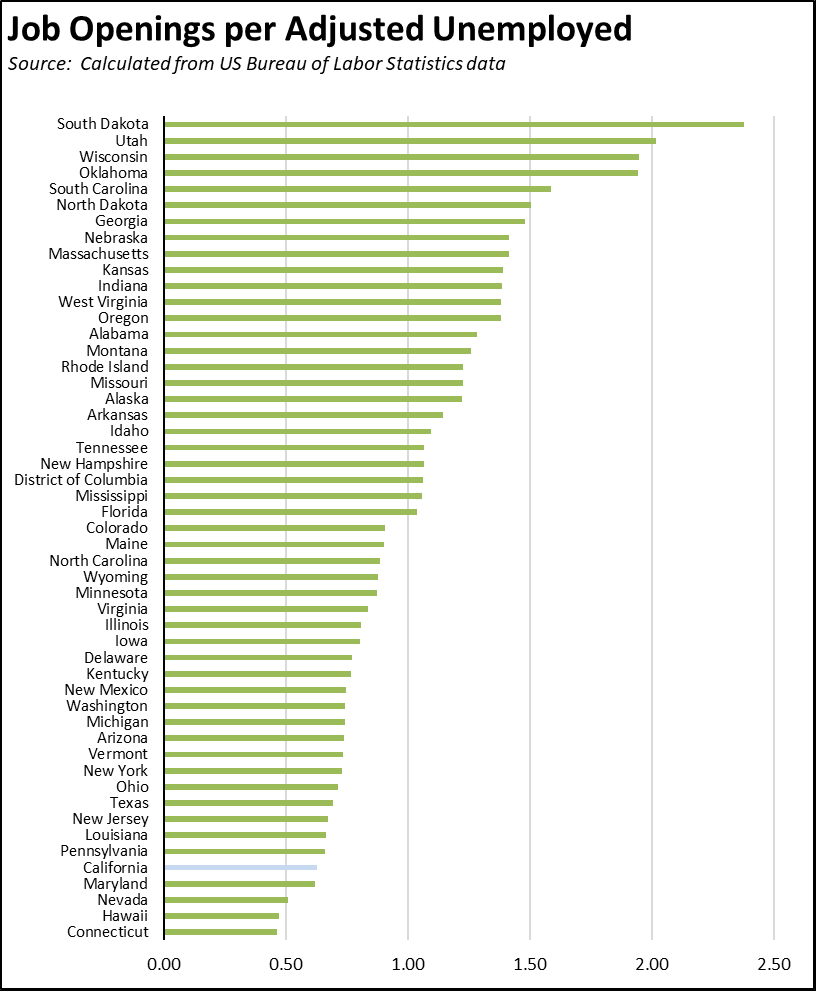
The prospects within California compared to the other states can be considered using the new Job Openings and Labor Turnover Survey (JOLTS) estimates now being published for the states. In the chart below, the states are ranked according to the number of unfilled job openings in September per adjusted unemployed, with adjusted unemployed calculated from the official number of unemployed plus workers who have not returned to the labor force since leaving after February 2020.
Job openings within California remain elevated as with the rest of country, with September openings about 400,000 (50%) above the 2019 average. But even at this level, the number is not good enough to overcome the state’s recovery lag. Openings at this level indicate the state’s job numbers likely will continue to be positive in the coming months, but not necessarily at levels that would close the recovery gap with an increasing number of other states, especially the employment gap. Overall, jobs potential remains higher elsewhere, especially in those states showing one or more jobs available for each unemployed worker, assuming consequent higher wages from this situation counters the current labor shortages standing in the way.
Using this measure, California remains poised to continue in its recovery mode for the foreseeable future under current policies. A great many other states—those near or above the one job per unemployed—are instead poised to move into a renewed growth phase. While California has the potential to do better, especially for a wider range of employment opportunities beyond the tech and other higher-wage jobs that have grown throughout this period, state policies continue to emphasize growth in social assistance programs rather than reforms to accelerate a wider range of job types.
Job openings also do not necessarily match up with the unemployed. The numbers in the chart are based on aggregate job openings, and available skill levels among unemployed workers do not necessarily equate with the available job needs. Again using national data from September, the largest number of job openings were in Professional & Business Services (17.1%) followed by Health Care & Social Assistance (16.7%). Combined, Retail Trade, Leisure & Hospitality, and Other Services were 29.6%. The state closures, however, created a much different distribution among the unemployed. Professional & Business Services and Health Care & Social Assistance combined were only 12% of the total job losses in the initial round of California’s closures. In contrast, lower-wage Retail Trade, Leisure & Hospitality, and Other Services accounted for 55%.
CaliFormer Businesses: Update
Additional CaliFormer companies identified since our last monthly report are shown below. In addition to the regular updates, the list also contains Califormer companies identified in a recent study by Joseph Vranich and Lee Ohanian, but which were not covered in our previous listings. These additions from the study cover only those since 2018, when the housing market had recovered and made it more possible economically for companies and their workers to consider a move.
Companies listed below include those that have announced: (1) moving their headquarters or full operations out of state, (2) moving business units out of state (generally back-office operations where the employees do not have to be in a more costly California location to do their jobs), (3) California companies that expanded out of state, and (4) companies turning to permanent telework options, leaving it to their employees to decide where to work and live.
| wdt_ID | Companies | From | To | Reason | Source | Year |
|---|---|---|---|---|---|---|
| 167 | 1Life Healthcare Inc. | San Francisco | Atlanta | Expansions | Read More | 2021 |
| 168 | Aatonomy | San Francisco | Houston | HQ move | Read More | 2018 |
| 169 | Abyss Creations | San Marcos | Las Vegas | HQ move | Read More | 2021 |
| 170 | Adlucent | Irvine | Austin | HQ move | Read More | 2019 |
| 171 | AFC Finishing Systems | Oroville | Idaho | HQ move | Read More | 2020 |
| 172 | AgencyKPI Inc. | Los Angeles | Austin | HQ move | Read More | 2020 |
| 173 | Aging 2.0 | San Francisco | Louisville | HQ move | Read More | 2020 |
| 174 | Airbrake Technologies | San Francisco | Austin | HQ move | Read More | 2020 |
| 175 | Alfresco Software Inc. | San Mateo | Massachusetts | HQ move | Read More | 2019 |
| 176 | Alpha Paw LLC | San Francisco | Austin | HQ move | Read More | 2021 |
| Companies | From | To | Reason | Source | Year |
Employment 948k Below Recovery
EDD reported that employment (seasonally adjusted; October preliminary) was up 32,700 from the revised September numbers, while the number of unemployed was down by 41,200.
The reported unemployment rate improved 0.2 point to 7.3% compared to 4.3% in February 2020 prior to the pandemic. California again tied with Nevada for the highest unemployment rate among the states.
The national results again were somewhat stronger, with total US employment rising 359,000, and the number of unemployed dropping 255,000. The reported unemployment rate improved 0.2 point to 4.6%, compared to 3.5% in February 2020.
Figure Sources: California Employment Development Department; US Bureau of Labor Statistics
In the seasonally adjusted numbers, California employment remains 948,600 (5.1%) below the pre-pandemic level in February 2020; the rest of the states combined were 2.7% below. California was the 10th lowest ranked by employment recovery level, while 10 states were above the pre-pandemic February 2020 employment levels.
Labor Force Participation Rate
The labor force participation rate dipped 0.1 point to 61.0%, while the US number was unchanged at 61.6%. The California rate remains well below the pre-pandemic level of 62.5%, which in turn was down substantially from prior years. Accounting for workers leaving the workforce since February 2020, there were 1.8 million out of work in October.
Nonfarm Jobs: 886k Below Recovery
Nonfarm wage and salary jobs were up 47,400 (seasonally adjusted) in October, while gains in September were revised down by 9,600.
Compared to the February 2020 numbers (seasonally adjusted) just prior to the pandemic, nonfarm wage and salary jobs in California were 886,300 short of recovery, or 21.1% of the national shortfall.
California had the 14th lowest rate of jobs recovery. In the seasonally adjusted numbers, two states—Utah and Idaho—continue to exceed the pre-pandemic levels, moving from recovery to growth.
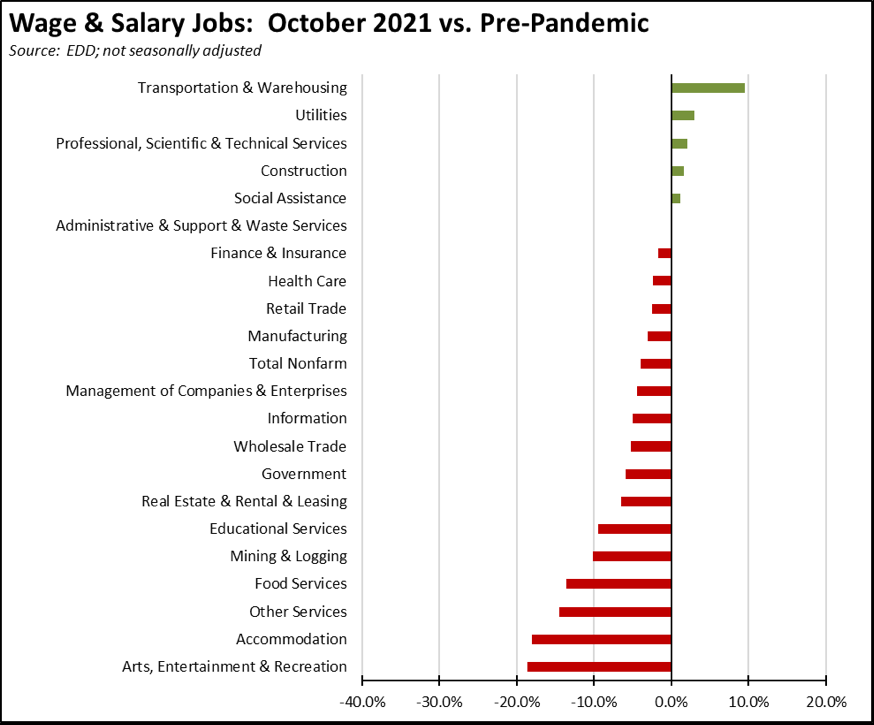
Jobs Change by Industry
Using the unadjusted numbers that allow a more detailed look at industry shifts, 6 industries showed job levels at or exceeding the pre-pandemic February 2020 levels. The strongest lags in recovery continue to the those lower-wage industries that were hardest hit by the state-ordered closures: Arts, Entertainment & Recreation, Accommodation, Other Services, and Food Services. The relative levels of Government and Educational Services continue to be affected by seasonal factors as schools continued reopening in October.
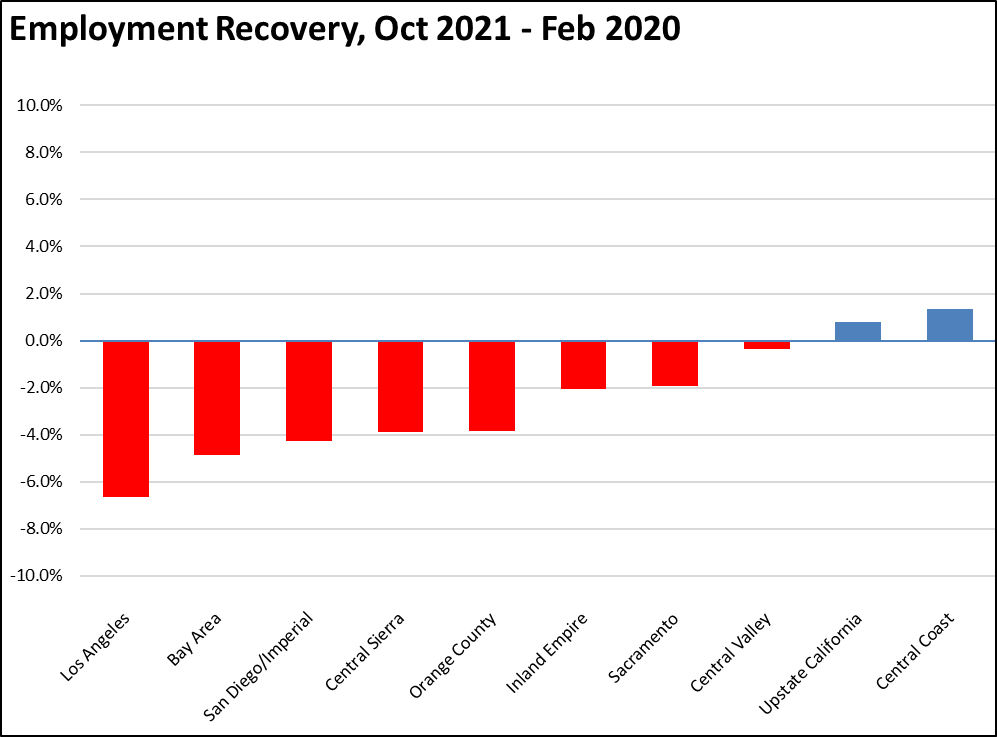
Employment Recovery by Region
Comparing October employment to pre-pandemic February 2020, Los Angeles Region lagged behind the rest of the state, showing a loss of 6.6% and containing 49% of the total employment shortfall in the state compared to 29% of the total population. Central Coast and Upstate California remained in the growth category.
Unemployment Rates by Legislative Districts
The highest and lowest estimated unemployment rates in October are shown below.
Lowest
| wdt_ID | Congressional District | Unemployment Rate |
|---|---|---|
| 2 | CD18 (Eshoo-D) | 3.0 |
| 3 | CD17 (Khanna-D) | 3.7 |
| 4 | CD02 (Huffman-D) | 4.1 |
| 5 | CD52 (Peters-D) | 4.1 |
| 6 | CD12 (Pelosi-D) | 3.8 |
| 7 | CD14 (Speier-D) | 3.9 |
| 9 | CD15 (Swalwell-D) | 4.1 |
| 10 | CD19 (Lofgren-D) | 4.3 |
| 12 | CD49 (Levin-D) | 4.3 |
| 13 | CD45 (Porter-D) | 4.3 |
| wdt_ID | Senate District | Unemployment Rate |
|---|---|---|
| 2 | SD13 (Hill-D) | 3.3 |
| 3 | SD15 (Beall-D) | 3.8 |
| 4 | SD11 (Wiener-D) | 4.0 |
| 5 | SD10 (Wieckowski-D) | 4.1 |
| 6 | SD36 (Bates-R) | 4.2 |
| 7 | SD01 (Dahle-R) | 4.5 |
| 8 | SD39 (Atkins-D) | 4.3 |
| 9 | SD02 (McGuire-D) | 4.4 |
| 10 | SD37 (Moorlach-R) | 4.3 |
| 11 | SD17 (Monning-D) | 4.9 |
| wdt_ID | Assembly District | Unemployment Rate |
|---|---|---|
| 2 | AD28 (Low-D) | 3.0 |
| 3 | AD24 (Berman-D) | 3.3 |
| 4 | AD22 (Mullin-D) | 3.3 |
| 5 | AD16 (Bauer-Kahan-D) | 3.6 |
| 6 | AD73 (Brough-R) | 4.0 |
| 7 | AD10 (Levine-D) | 4.0 |
| 8 | AD06 (Kiley-R) | 3.9 |
| 9 | AD25 (Chu-D) | 3.8 |
| 10 | AD17 (Chiu-D) | 3.8 |
| 11 | AD78 (Gloria-D) | 4.1 |
Highest
| wdt_ID | Congressional District | Unemployment Rate |
|---|---|---|
| 2 | CD29 (Cardenas-D) | 7.8 |
| 3 | CD37 (Bass-D) | 7.9 |
| 4 | CD28 (Schiff-D) | 8.0 |
| 5 | CD34 (Gomez-D) | 8.7 |
| 6 | CD16 (Costa-D) | 8.9 |
| 7 | CD32 (Napolitano-D) | 7.9 |
| 9 | CD21 (Cox-D) | 9.5 |
| 10 | CD40 (Roybal-Allard-D) | 9.5 |
| 12 | CD51 (Vargas-D) | 10.6 |
| 13 | CD44 (Barragan-D) | 10.6 |
| wdt_ID | Senate District | Unemployment Rate |
|---|---|---|
| 2 | SD22 (Rubio-D) | 7.1 |
| 3 | SD12 (Caballero-D) | 7.4 |
| 4 | SD21 (Wilk-R) | 8.5 |
| 5 | SD35 (Bradford-D) | 8.8 |
| 6 | SD24 (Durazo-D) | 8.8 |
| 7 | SD18 (Hertzberg-D) | 7.9 |
| 9 | SD30 (Mitchell-D) | 9.0 |
| 10 | SD33 (Gonzalez-D) | 9.1 |
| 12 | SD40 (Hueso-D) | 9.4 |
| 13 | SD14 (Hurtado-D) | 10.4 |
| wdt_ID | Assembly District | Unemployment Rate |
|---|---|---|
| 2 | AD46 (Nazarian-D) | 8.8 |
| 3 | AD31 (Arambula-D) | 9.3 |
| 4 | AD36 (Lackey-R) | 9.2 |
| 5 | AD63 (Rendon-D) | 9.8 |
| 6 | AD32 (Salas-D) | 9.6 |
| 7 | AD26 (Mathis-R) | 9.0 |
| 9 | AD51 (Carrillo-D) | 9.9 |
| 10 | AD64 (Gipson-D) | 10.3 |
| 12 | AD59 (Jones-Sawyer-D) | 10.4 |
| 13 | AD56 (Garcia-D) | 11.3 |
Unemployment Rates by Region
Unemployment rates (not seasonally adjusted) compared to pre-pandemic February 2020 show Los Angeles Region remaining the second worst in the state.
| wdt_ID | Region | October - 21 | February - 20 |
|---|---|---|---|
| 2 | California | 6.4 | 4.3 |
| 6 | Bay Area | 4.6 | 2.7 |
| 10 | Orange County | 5.0 | 7.0 |
| 14 | Central Coast | 5.3 | 4.6 |
| 18 | Sacramento | 5.5 | 4.5 |
| 22 | Central Sierra | 5.5 | 8.4 |
| 26 | Upstate California | 5.9 | 2.8 |
| 30 | San Diego/Imperial | 6.1 | 3.9 |
| 34 | Inland Empire | 6.6 | 3.7 |
| 38 | Los Angeles | 7.9 | 6.3 |
| 39 | Central Valley | 8.0 | 3.8 |
Figure Source: California Employment Development Department
MSAs with the Worst Unemployment Rates
California again had 11 of the MSAs among the 25 regions with the worst unemployment rates in September, including El Centro MSA (Imperial County) with the worst unemployment rate in the nation.
| wdt_ID | MSA | September Unemployment Rate | US Rank out of 389 |
|---|---|---|---|
| 1 | El Centro MSA | 18.1 | 389 |
| 2 | Visalia-Porterville MSA | 9.3 | 387 |
| 3 | Bakersfield MSA | 8.7 | 385 |
| 4 | Merced MSA | 8.2 | 384 |
| 5 | Hanford-Corcoran MSA | 8.0 | 380 |
| 6 | Fresno MSA | 7.8 | 379 |
| 7 | Stockton-Lodi MSA | 7.5 | 376 |
| 8 | Los Angeles-Long Beach-Anaheim MSA | 7.4 | 374 |
| 9 | Madera MSA | 7.3 | 372 |
| 10 | Yuba City MSA | 7.2 | 371 |
| 11 | Modesto MSA | 6.9 | 365 |