The Center for Jobs and the Economy has released our initial analysis of the May Employment Report from the California Employment Development Department. For additional information and data about the California economy visit www.centerforjobs.org/ca.
Highlights for policy makers:
- Recovery Progress: CA vs. US
- Recovery Progress: CA Jobs by Wage Level
- California Labor Force
- Recovery Progress: CA Employment vs. Other States
- Nonfarm Jobs
- Recovery Progress: CA Nonfarm Jobs vs. Other States
- JOB OPENINGS
- Nonfarm Jobs by Region
- Unemployment Rates by Region
- Employment Recovery by Region
- Counties with Double-Digit Unemployment
- MSAs with the Worst Unemployment Rates
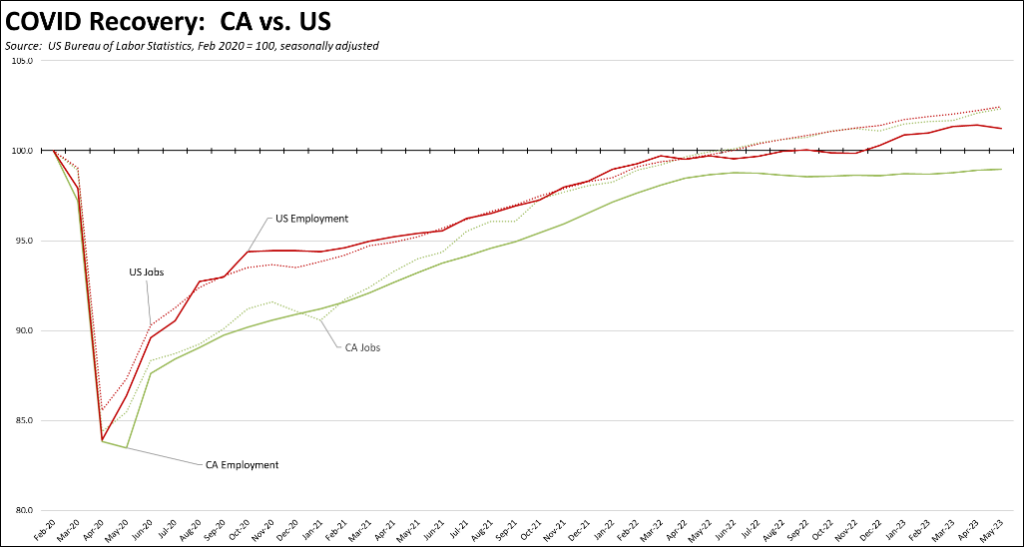
Recovery Progress: CA vs. US
The May data again was positive but showed slower gains than in April. Nonfarm jobs (seasonally adjusted) rose 47,300 in May, somewhat below the revised 69,900 for April but 22% higher than the average in the preceding 12 months. Employment also showed a gain, but moderated substantially from the prior two months with an increase of only 9,900. Nonfarm jobs remain above the pre-pandemic high, but employment still has yet to reach this recovery level. Employment remains 193,400 (1.0%) below the pre-pandemic peak in February 2020. Even with the uptick of now the last three months, California employment has remained essentially unchanged since last June, putting pressure on the state’s ability to expand jobs going forward.
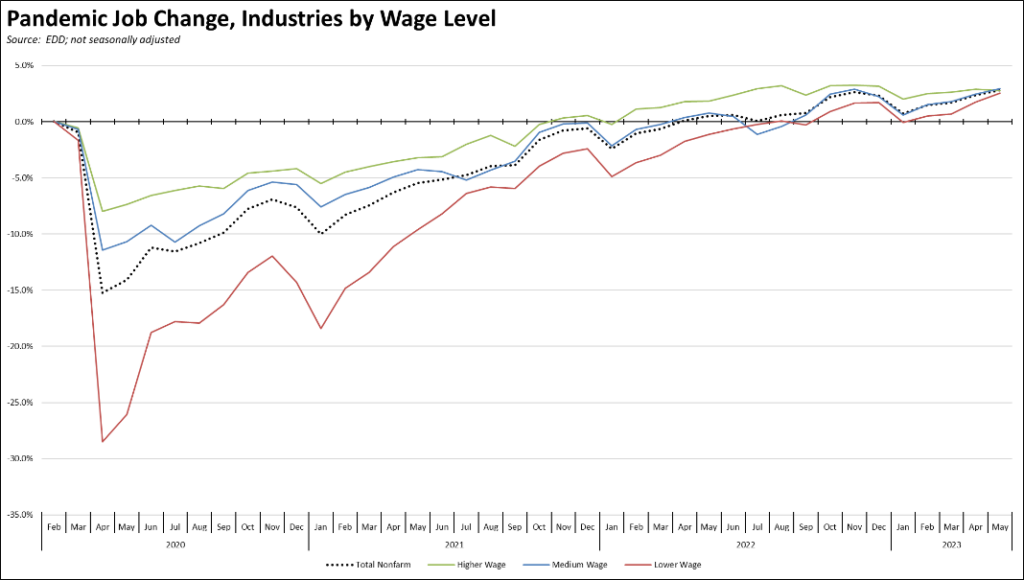
Recovery Progress: CA Jobs by Wage Level
Using the unadjusted series to provide a more detailed look at jobs by industry wage level, recovery across the three wage levels began to converge as gains in the higher wage industries dipped while lower wage and medium wage industries grew due to seasonal factors.
California Labor Force
California’s reported unemployment rate (seasonally adjusted) in May was unchanged at 4.5%. The US rate rose 0.3 point to 3.7%.
California again had the 3rd highest unemployment rate among the states and DC.
Employment was up 9,900 (seasonally adjusted). US employment was down 310,000.
California unemployment rose 14,900, while US unemployment was up by 440,000.
California labor force numbers (seasonally adjusted) saw a positive gain of 24,700, pushing the labor force participation rate up 0.1 point to 62.5%. The US labor force was essentially unchanged with a gain of 130,000, while the participation rate was unchanged at 62.6%.
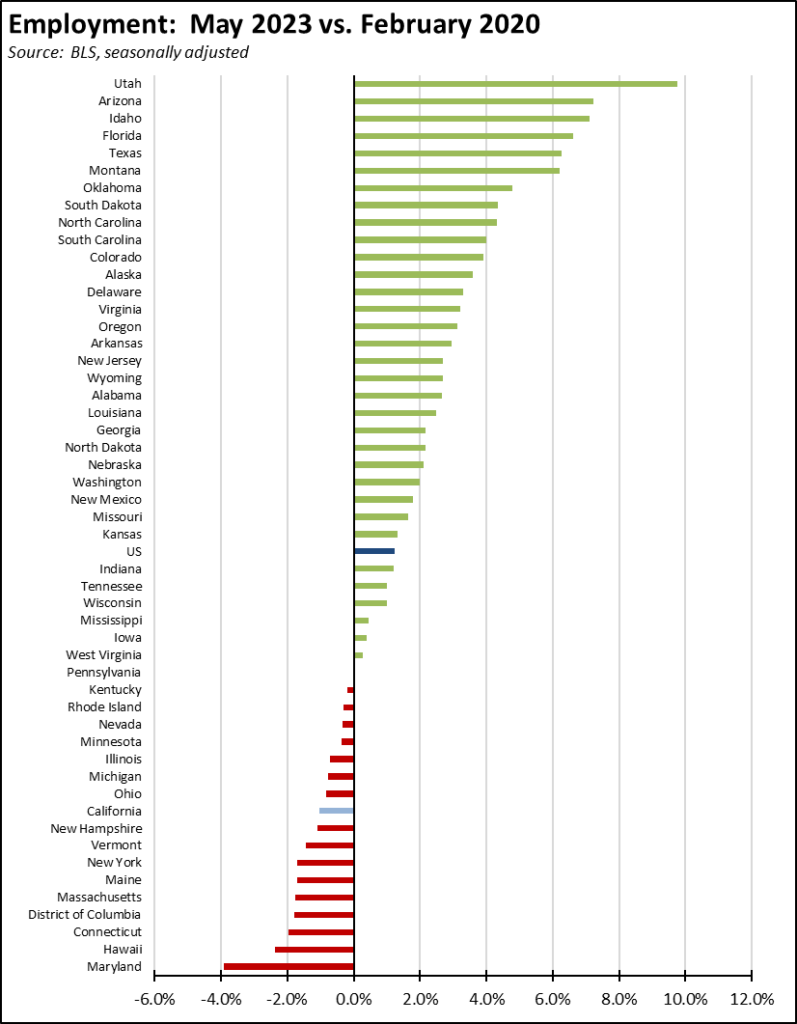
Recovery Progress: CA Employment vs. Other States
Compared to the pre-pandemic peak in February 2020, California’s continued weak employment recovery edged the state’s ranking down to 42nd highest among the states and DC.
![]()
Nonfarm Jobs
Nonfarm wage and salary jobs were up 47,300 (seasonally adjusted), while the previously reported April gains were revised up by 2,900 to 69,900.
Nonfarm jobs nationally were up 399,000 in May.
The seasonally adjusted numbers for California showed gains in all but 5 industries, with the increases led by Health Care & Social Assistance (15,300), Professional, Scientific & Technical Services (11,600), and Accommodation & Food Services (8,100). Losses were led by Wholesale Trade (-5,800), Manufacturing (-5,700), and Information (-2,800), which contains the major tech industry components.
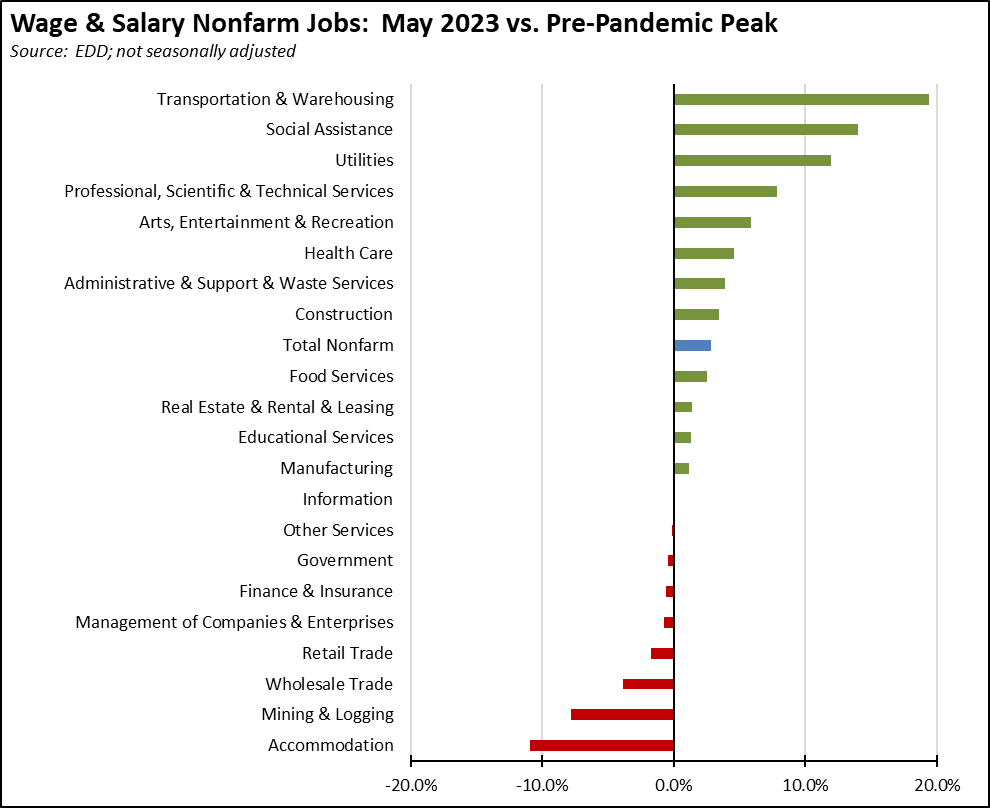
Using the unadjusted numbers to show a more detailed industry breakdown, blue collar, middle-class wage Transportation & Warehousing continues to show the strongest recovery compared to the pre-pandemic peak. As trade has been hampered by the ongoing labor negotiations and as state and local opposition to new warehousing has increased, these gains are quickly being made instead by Social Assistance—largely composed of government-funded and very low wage In-home Supportive Services (IHSS). Weakest recovery continues to be the blue collar, higher-wage jobs in Mining & Logging targeted by state policy for reductions and in the lower-wage Accommodation jobs that were heavily impacted by the state shutdown policies.
Recovery Progress: CA Nonfarm Jobs vs. Other States
On a comparative basis, California’s 47,300 jobs gain was the second highest among the states and DC. Texas was highest at 51,000 and New York third at 30,400. Compared to the pre-pandemic peak in February 2020, California with real job gains of 415,600 again was third, behind Texas (947,400) and Florida (658,500). On a comparative basis, California’s recovery rate again ranked 21st highest among the states. Thirteen states and DC remained below their pre-pandemic peaks.
![]()
JOB OPENINGS
California unfilled job openings at the end of March continued dropping to 0.911 million, down 74,000 from February and down 434,000 since the peak last May. While unfilled job openings remain high and represent a potential source of growth for both state incomes and tax revenues, the downward trend since last November largely reflects businesses in the state pulling back on their hiring plans. Nationally, job openings dropped 384,000 in March to 9.59 million but again rose in April to 10.1 million.
Nonfarm Jobs by Region
The change in nonfarm jobs (seasonally adjusted) from April and net growth since pre-pandemic February 2020 are shown below. The interior regions show the largest net job gains since the pre-pandemic peak, while the Bay Area and Los Angeles Regions show comparable net change. These two regions, however, led in the May 2023 jobs growth even with the continued factors affecting the tech industry in the Bay Area.
Because the data in the table is seasonally adjusted, the numbers should be considered as the total for the MSAs in each region rather than the regional number. This job series also is not available for all areas in California.
Unemployment Rates by Region
Unemployment rates (not seasonally adjusted) compared to pre-pandemic February 2020 are shown below. As the Bay Area continues to be affected by tech industry layoffs and slower hiring, Orange County again posted the lowest unemployment rate.
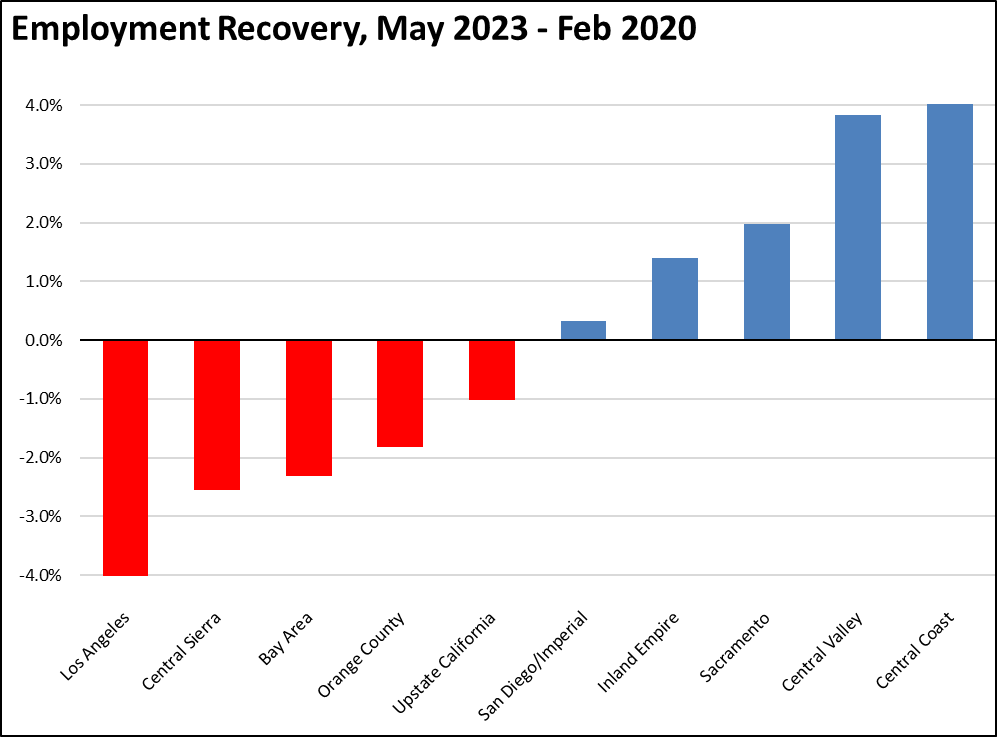
Employment Recovery by Region
Los Angeles Region continues to lag the rest of the state in recovery to the pre-pandemic peak employment levels (not seasonally adjusted).
Counties with Double-Digit Unemployment
The number of counties with an unemployment rate (not seasonally adjusted) at 10% or more edged up to 3. The unadjusted rates ranged from 2.7% in San Mateo to 16.0% in Imperial.
MSAs with the Worst Unemployment Rates
The number of California MSAs among the 25 regions with the worst unemployment rates in April continued increasing from 13 to 14—more than half of the total 26 California MSAs. Los Angeles-Long Beach-Anaheim MSA dropped to #347 in a tie with 3 other MSAs including Vallejo-Fairfield MSA. San Jose-Sunnyvale-Santa Clara was again the highest ranked California MSA, tied at #211 with 13 other MSAs.