Download September 2018 Jobs Report
Highlights for policy makers:
- Unemployment Rate Level at 4.1%; Total Employment Up 34,600
- Labor Force Participation Rate Level at 62.0%
- State Employment Growth Rankings—California Remains at 5th
- Nonfarm Jobs Up 13,200
- Four Industries Still below 2007 Pre-Recession Job Levels
- Job Gains by Wage Level
- Two-Tier Economy Persists—Central Valley Unemployment More than Twice as High as Bay Area
- Bay Area Provided 39.5% of Net Employment Growth Since Recession
- Six California MSAs in the 10 Worst Unemployment Rates Nationally
Unemployment Rate Level at 4.1%; Total Employment up 34,600
The Labor Force data for September 2018 (seasonally adjusted; California preliminary) is shown below, along with the change from the prior month:
| Seasonally Adjusted | California | US | ||
|---|---|---|---|---|
| Sep 2018 | Change from Aug 2018 | Sep 2018 | Change from Aug 2018 | |
| Unemployment Rate | 4.1% | -0.1 | 3.7% | -0.2 |
| Labor Force | 19,385,000 | 0.2% | 161,926,000 | 0.1% |
| Participation Rate | 62.0% | 0.1 | 62.7% | 0.0 |
| Employment | 18,582,400 | 0.2% | 155,962,000 | 0.3% |
| Unemployment | 803,000 | 0.0% | 5,964,000 | -4.3% |
The related not seasonally adjusted numbers (California preliminary), with the change from September 2017:
| Not Seasonally Adjusted | California | US | ||
|---|---|---|---|---|
| Sep 2018 | Change from Sep 2017 | Sep 2018 | Change from Sep 2017 | |
| Unemployment Rate | 3.9% | -0.4 | 3.6% | -0.5 |
| Labor Force | 19,552,500 | 0.5% | 161,958,000 | 0.6% |
| Participation Rate | 62.5% | -0.2 | 62.7% | -0.3 |
| Employment | 18,783,600 | 0.9% | 156,191,000 | 1.1% |
| Unemployment | 768,900 | -8.6% | 5,766,000 | -12.1% |
California Employment Development Department’s (EDD) latest data shows on a seasonally adjusted basis, total employment rose 34,600 from August, while the number of unemployed fell 300. The labor force grew by 34,300.
California’s seasonally adjusted unemployment rate improved to 4.1%, the lowest level in the current data series that began in 1976. California tied with Illinois, New York, Pennsylvania, and Wyoming for the 15th highest unemployment rate among the states. The unadjusted rate dropped from 4.3% in September 2017 to 3.9%.
Total US employment saw a seasonally adjusted gain of 420,000 from August, while the number of unemployed dropped by 270,000 and the total labor force grew by 150,000. The national unemployment rate improved to 3.7%.
Labor Force Participation Rate Level at 62.0%
California’s participation rate (seasonally adjusted) in September notched up to 62.0%, while the US rate remained level at 62.7%.
California’s labor force remained essentially unchanged, growing only 4,800 over the year ending September 2018, or 0.0% growth. The US as a whole grew 0.8 million – a 0.5% expansion. While workers elsewhere continue to return to the workforce, California’s continued low rate has implications for future growth in the state, including the ability to sustain jobs expansion as fewer workers are available and continued effects on state and local budgets for higher social program spending compared to other states.
Considered by age, the prime working age groups in California (age 25-54 and 55-64) remain somewhat below their previous highs since 2000, with youth employment remaining below levels from a year ago. These trends in particular have long-term implications for income distributions in the state, as most studies indicate that work skills developed through early employment are correlated with long-term earnings potential. In contrast to the younger groups, persons 65 and older show a higher labor force participation rate compared to the prior low at the beginning of this period.
Labor Force Participation Rate by Age (12-month moving average)
| Prior Max | September 2018 | |
|---|---|---|
| Total | 67.2% | 62.2% |
| 16-19 | 46.8% | 27.2% |
| 20-24 | 76.4% | 65.6% |
| 25-54 | 82.1% | 80.3% |
| 55-64 | 66.3% | 63.8% |
| Prior Min | ||
| 65+ | 12.1% | 19.5% |
State Employment Growth Rankings—California Remains at 5th
Change in Employment, September 2017 – September 2018
| Rank | Number of Employed | Percentage Change | Population Adjusted (employment growth per 1,000 civilian noninstitutional population) |
|---|---|---|---|
| 1 | TX 251,500 | MA 4.5% | MA 28.2 |
| 2 | MA 157,700 | NV 2.8% | NV 16.7 |
| 3 | FL 148,800 | NM 2.6% | CO 15.5 |
| 4 | GA 106,000 | DE 2.5% | DE 14.6 |
| 5 | CA 81,100 | CO 2.3% | NM 14.2 |
| 6 | IN 71,400 | IN 2.2% | IN 13.8 |
| 7 | CO 68,500 | GA 2.2% | GA 13.2 |
| 8 | VA 62,400 | NH 1.9% | NH 12.8 |
| 9 | NC 60,600 | TX 1.9% | TX 11.8 |
| 10 | AZ 48,600 | OK 1.9% | ID 11.7 |
| 11 | NY 45,800 | ID 1.9% | DC 11.4 |
| 12 | MN 43,200 | DC 1.7% | OK 11.2 |
| 13 | NV 39,400 | AL 1.7% | RI 10.1 |
| 14 | AL 34,900 | RI 1.6% | MN 9.9 |
| 15 | IL 34,200 | AZ 1.5% | VA 9.4 |
| 16 | OK 33,500 | FL 1.5% | AL 9.1 |
| 17 | WA 31,800 | VA 1.5% | AZ 8.9 |
| 18 | MI 29,900 | MN 1.5% | FL 8.7 |
| 19 | TN 25,800 | NC 1.3% | UT 8.1 |
| 20 | MO 25,500 | UT 1.2% | NC 7.5 |
| 21 | PA 23,600 | IA 1.1% | IA 7.4 |
| 22 | NM 23,000 | KY 1.0% | NE 6.7 |
| 23 | KY 20,200 | NE 1.0% | SD 6.7 |
| 24 | WI 18,600 | SD 1.0% | KY 5.8 |
| 25 | IA 18,200 | MS 0.9% | WIA 5.4 |
| 26 | UT 18,200 | WA 0.9% | MO 5.3 |
| 27 | ID 15,300 | MO 0.9% | TN 4.9 |
| 28 | NH 14,100 | TN 0.8% | MS 4.8 |
| 29 | DE 11,200 | ME 0.7% | VT 4.7 |
| 30 | MS 10,900 | VT 0.7% | ME 4.4 |
| 31 | NE 9,900 | MI 0.6% | WI 4.0 |
| 32 | RI 8,700 | WI 0.6% | MI 3.6 |
| 33 | SC 7,000 | HI 0.6% | HI 3.5 |
| 34 | DC 6,500 | IL 0.6% | IL 3.4 |
| 35 | KS 6,400 | NY 0.5% | KS 2.9 |
| 36 | OH 6,100 | KS 0.4% | NY 2.9 |
| 37 | ME 4,900 | CA 0.4% | CA 2.6 |
| 38 | SD 4,400 | PA 0.4% | PA 2.3 |
| 39 | HI 3,800 | SC 0.3% | SC 1.8 |
| 40 | LA 3,200 | LA 0.2% | LA 0.9 |
| US 2,071,000 | US 1.3% | US 8.1 |
Between September 2017 and September 2018, Bureau of Labor Statistics (BLS) data shows the total number of employed in California increased by 81,100 (seasonally adjusted), or 3.9% of the total net employment gains in this period for the US. Based on the total numbers, California remained in 5th place behind Texas, Massachusetts, Florida, and Georgia. Measured by percentage change in employment over the year, California fell to 37th highest. Adjusted for working age population, California was 37th as well.
Nonfarm Jobs Up 13,200
EDD reported that between August and September 2018, seasonally adjusted nonfarm wage and salary jobs grew by 13,200. August’s results were revised to a 42,600 gain from the previously reported 44,800.
In the not seasonally adjusted nonfarm numbers that allow a more detailed look at industry shifts, hiring saw increases in all but 5 industries over the year. The change in total payroll jobs from September 2017 saw the largest increases in lower wage Food Services (43,800), higher wage Professional, Scientific & Technical Services (39,200), and Government (38,100). Declines were in Other Services (-3,900) and Mining & Logging (-300).
| Not Seasonally Adjusted Payroll Jobs | Sep 2018 | Aug 2018 | Change Sep 2018 – Aug 2018 | Change Sep 2018 – Sep 2017 |
|---|---|---|---|---|
| Total Farm | 484,300 | 481,700 | 2,600 | 8,600 |
| Mining and Logging | 22,700 | 22,600 | 100 | -300 |
| Construction | 872,900 | 879,000 | -6,100 | 35,100 |
| Manufacturing | 1,326,400 | 1,332,600 | -6,200 | 200 |
| Wholesale Trade | 727,800 | 727,400 | 400 | 2,300 |
| Retail Trade | 1,688,500 | 1,694,700 | -6,200 | 8,600 |
| Utilities | 58,100 | 58,100 | 0 | 100 |
| Transportation & Warehousing | 595,600 | 594,500 | 1,100 | 20,900 |
| Information | 542,500 | 546,500 | -4,000 | 8,900 |
| Finance & Insurance | 545,800 | 551,300 | -5,500 | 0 |
| Real Estate & Rental & Leasing | 288,100 | 288,200 | -100 | 3,200 |
| Professional, Scientific & Technical Services | 1,267,900 | 1,274,400 | -6,500 | 39,300 |
| Management of Companies & Enterprises | 234,700 | 235,300 | -600 | 3,600 |
| Administrative & Support & Waste Services | 1,161,300 | 1,146,100 | 15,200 | 37,100 |
| Educational Services | 366,300 | 354,800 | 11,500 | 9,600 |
| Health Care | 1,531,300 | 1,535,000 | -3,700 | 24,700 |
| Social Assistance | 818,900 | 815,300 | 3,600 | 37,400 |
| Arts, Entertainment & Recreation | 320,900 | 324,000 | -3,100 | 16,200 |
| Accommodation | 237,000 | 237,100 | -100 | 9,100 |
| Food Services | 1,465,700 | 1,472,000 | -6,300 | 43,800 |
| Other Services | 560,400 | 564,300 | -3,900 | -6,500 |
| Government | 2,556,500 | 2,475,300 | 81,200 | 38,100 |
| Total Nonfarm | 17,189,300 | 17,128,500 | 60,800 | 331,400 |
| Total Wage and Salary | 17,673,600 | 17,610,200 | 63,400 | 340,000 |
At a 339,600 increase, California remained at 3rd highest measured by seasonally adjusted nonfarm jobs among the states from September 2017 to September 2018, behind Florida at 407,300 and Texas at 406,400. By percentage growth in jobs, California fell to 16th highest at 2.0%, but still above the US average. By population adjusted jobs growth, California rose to dropped to 20th highest.
Change in Nonfarm Jobs (seasonally adjusted), September 2017 – September 2018
| Rank | Number of Jobs | Employment Growth (%) | Population Adjusted (jobs growth per 1,000 civilian noninstitutional population) |
|---|---|---|---|
| 1 | FL 407,300 | FL 4.8% | FL 23.9 |
| 2 | TX 406,400 | UT 3.6% | UT 23.2 |
| 3 | CA 339,600 | TX 3.3% | TX 19.0 |
| 4 | GA 111,100 | NV 3.2% | NV 18.4 |
| 5 | WA 105,200 | WA 3.2% | WA 18.0 |
| 6 | OH 104,600 | AZ 2.9% | CO 17.5 |
| 7 | NY 95,300 | CO 2.9% | AZ 14.8 |
| 8 | NC 82,300 | ID 2.7% | ID 14.7 |
| 9 | AZ 81,400 | NM 2.6% | WY 14.1 |
| 10 | PA 78,700 | GA 2.5% | DC 14.0 |
| 11 | CO 77,200 | OR 2.3% | GA 13.8 |
| 12 | VA 68,400 | WY 2.2% | NH 13.5 |
| 13 | TN 63,900 | NH 2.2% | NM 13.1 |
| 14 | MA 63,400 | TN 2.1% | OR 12.9 |
| 15 | MI 63,300 | OK 2.0% | TN 12.1 |
| 16 | NJ 58,000 | CA 2.0% | NE 11.9 |
| 17 | UT 52,400 | OH 1.9% | OH 11.4 |
| 18 | IL 50,300 | NC 1.9% | MA 11.3 |
| 19 | NV 43,500 | HI 1.8% | OK 11.3 |
| 20 | OR 43,200 | TN 1.8% | CA 10.9 |
| 21 | WI 41,700 | DE 1.8% | HI 10.6 |
| 22 | MO 39,300 | MA 1.8% | DE 10.4 |
| 23 | MN 38,200 | VA 1.7% | VA 10.3 |
| 24 | OK 34,000 | NE 1.7% | NC 10.2 |
| 25 | IN 28,000 | MT 1.6% | SD 9.4 |
| US2,537,000 | US1.7% | US9.9 |
Four Industries Still below 2007 Pre-Recession Job Levels
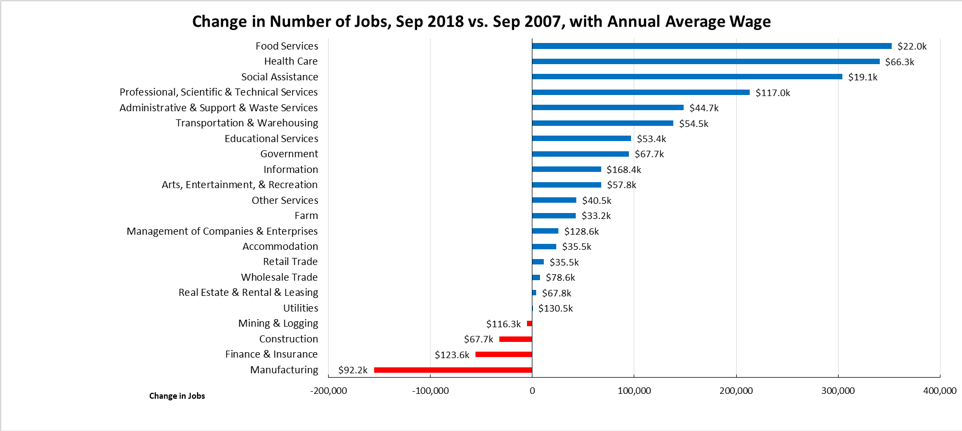
Comparing the number of jobs by industry in September 2018 (not seasonally adjusted), 4 industries had employment below the 2007 pre-recession levels. The highest gain industries were led by lower wage Food Services, Health Care (with a relatively higher mix of lower and higher wage occupations), lower wage Social Assistance, and higher wage Professional, Scientific & Technical Services. Of the lagging industries, three—Manufacturing, Mining & Logging, and Construction—are blue collar middle class wage industries. While slowing, Construction was still higher than in recent years but still remains 46,900 below the 2007 level, and 93,400 (9.7%) below the previous high in 2006.
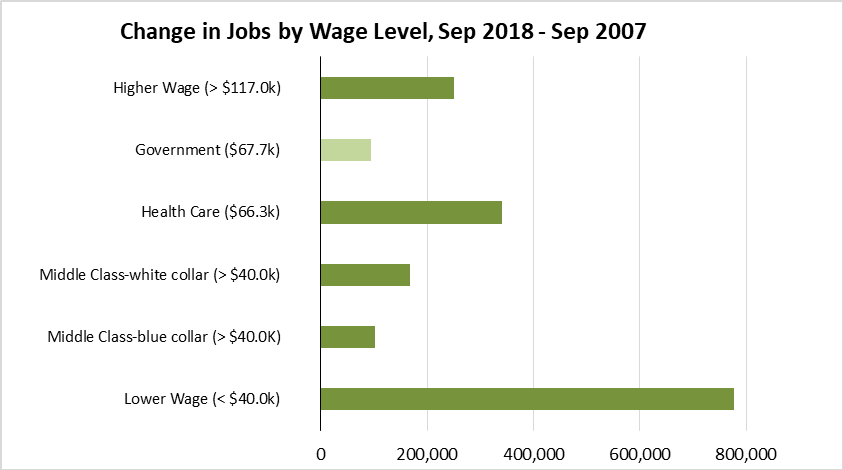
Job Gains by Wage Level
The following chart illustrates the trend for total wage and salary jobs by general wage level, according to the industry wage classification used previously in other Center analyses of this issue. As indicated, nearly half (45%) of net jobs growth since the recession has been in the lower wage industries. For the 12 months ending September 2018, lower wage industries accounted for under a third (30%) of new jobs, while middle class-blue collar jobs produced over a quarter (28%) as Construction levels remained higher compared to recent years.
Two-Tier Economy Persists—Central Valley Unemployment More than Twice as High as Bay Area
The level of unemployment rates (all data is not seasonally adjusted) continues to vary widely across the state, ranging from 2.6% in the Bay Area to more than twice as large at 6.0% in the Central Valley.
| Not Seasonally Adjusted | Unemployment Rate (%) September 2018 |
|---|---|
| California | 3.9 |
| Bay Area | 2.6 |
| Orange County | 2.8 |
| Sacramento | 3.4 |
| Central Coast | 3.5 |
| Central Sierra | 3.6 |
| San Diego/Imperial | 3.9 |
| Inland Empire | 4.1 |
| Upstate California | 4.3 |
| Los Angeles | 4.7 |
| Central Valley | 6.0 |
By Legislative District:
| Lowest 10 Unemployment Rates | |||||
|---|---|---|---|---|---|
| CD18 (Eshoo-D) | 2.1 | SD13 (Hill-D) | 2.1 | AD16 (Baker-R) | 2.0 |
| CD12 (Pelosi-D) | 2.3 | SD11 (Wiener-D) | 2.5 | AD22 (Mullin-D) | 2.0 |
| CD52 (Peters-D) | 2.5 | SD39 (Atkins-D) | 2.7 | AD24 (Berman-D) | 2.2 |
| CD17 (Khanna-D) | 2.5 | SD36 (Bates-R) | 2.7 | AD28 (Low-D) | 2.3 |
| CD14 (Speier-D) | 2.5 | SD37 (Moorlach-R) | 2.8 | AD17 (Chiu-D) | 2.4 |
| CD15 (Swalwell-D) | 2.6 | SD10 (Wieckowski-D) | 2.8 | AD77 (Maienschein-R) | 2.5 |
| CD45 (Walters-R) | 2.7 | SD07 (Glazer-D) | 2.8 | AD25 (Chu-D) | 2.5 |
| CD49 (Issa-R) | 2.7 | SD15 (Beall-D) | 2.8 | AD19 (Ting-D) | 2.6 |
| CD48 (Rohrabacher-R) | 2.9 | SD02 (McGuire-D) | 3.0 | AD73 (Brough-R) | 2.6 |
| CD02 (Huffman-D) | 2.9 | SD38 (Anderson-R) | 3.3 | AD78 (Gloria-D) | 2.6 |
| Highest 10 Unemployment Rates | |||||
|---|---|---|---|---|---|
| CD34 (Gomez-D) | 5.6 | SD21 (Wilk-R) | 5.5 | AD13 (Eggman-D) | 6.0 |
| CD29 (Cárdenas-D) | 5.8 | SD18 (Hertzberg-D) | 5.6 | AD51 (Carrillo-D) | 6.2 |
| CD43 (Waters-D) | 5.8 | SD33 (Lara-D) | 5.8 | AD36 (Lackey-R) | 6.4 |
| CD40 (Roybal-Allard-D) | 5.8 | SD24 (de León-D) | 5.8 | AD59 (Jones-Sawyer-D) | 6.6 |
| CD23 (McCarthy-R) | 6.3 | SD30 (Mitchell-D) | 6.0 | AD21 (Gray-D) | 7.1 |
| CD22 (Nunes-R) | 6.5 | SD12 (Cannella-R) | 6.0 | AD64 (Gipson-D) | 7.2 |
| CD44 (Barragán-D) | 7.0 | SD16 (Fuller-R) | 6.2 | AD31 (Arambula-D) | 7.7 |
| CD16 (Costa-D) | 7.2 | SD35 (Bradford-D) | 6.3 | AD26 (Mathis-R) | 8.4 |
| CD21 (Valadao-R) | 8.3 | SD40 (Hueso-D) | 7.7 | AD32 (Salas-D) | 8.7 |
| CD51 (Vargas-D) | 9.1 | SD14 (Vidak-R) | 9.1 | AD56 (Garcia-D) | 10.8 |
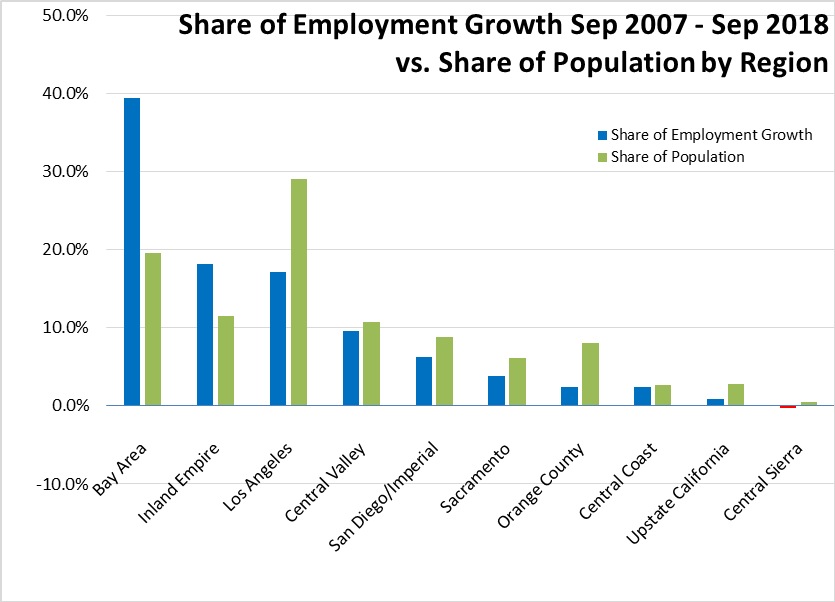
Bay Area Provided 39.5% of Net Employment Growth Since Recession
Containing 19.6% of the state’s population, the Bay Area was responsible for 39.5% of the net growth in employment since the pre-recession peaks in 2007. Los Angeles Region, containing 29.1% of the population, accounted for the third largest share at 17.2%. Inland Empire is the only other region—at a growing margin—continuing to show employment gains above their population share. Based on the preliminary September numbers, Inland Empire continues to eclipse Los Angeles Region for employment growth compared to before the recession.
Six California MSAs in the 10 Worst Unemployment Rates Nationally
According to BLS data, of the 10 Metropolitan Statistical Areas (MSAs) with the worst unemployment rates nationally, six are in California. Of the 20 worst, nine are in California.
| Metropolitan Area | August 2018 Rate | Rank |
|---|---|---|
| Yuma, AZ Metropolitan Statistical Area | 22.0 | 388 |
| El Centro, CA Metropolitan Statistical Area | 20.3 | 387 |
| Visalia-Porterville, CA Metropolitan Statistical Area | 8.7 | 386 |
| Bakersfield, CA Metropolitan Statistical Area | 7.3 | 385 |
| Merced, CA Metropolitan Statistical Area | 7.0 | 384 |
| Hanford-Corcoran, CA Metropolitan Statistical Area | 6.7 | 383 |
| Vineland-Bridgeton, NJ Metropolitan Statistical Area | 6.6 | 380 |
| McAllen-Edinburg-Mission, TX Metropolitan Statistical Area | 6.6 | 380 |
| Fresno, CA Metropolitan Statistical Area | 6.6 | 380 |
| Brownsville-Harlingen, TX Metropolitan Statistical Area | 6.2 | 377 |
| Beaumont-Port Arthur, TX Metropolitan Statistical Area | 6.3 | 379 |
| Madera, CA Metropolitan Statistical Area | 6.2 | 377 |
| Hammond, LA Metropolitan Statistical Area | 6.1 | 375 |
| Alexandria, LA Metropolitan Statistical Area | 6.1 | 375 |
| Sierra Vista-Douglas, AZ Metropolitan Statistical Area | 6.0 | 373 |
| Lake Havasu City-Kingman, AZ Metropolitan Statistical Area | 6.0 | 373 |
| Yuba City, CA Metropolitan Statistical Area | 5.9 | 368 |
| Shreveport-Bossier City, LA Metropolitan Statistical Area | 5.9 | 368 |
| Monroe, LA Metropolitan Statistical Area | 5.9 | 368 |
| Modesto, CA Metropolitan Statistical Area | 5.9 | 368 |
Note: All data sources, methodologies, and historical data series available at CenterforJobs.org/ca.