Below are highlights from the recently released trade data from the US Census Bureau and US Bureau of Economic Analysis. To view additional data and analysis related to the California economy visit our website at www.centerforjobs.org/ca.
Share of Goods through US Ports
17.7%
CA Share of Total Trade
Through US Ports
The share of total US goods trade (exports and imports) through California ports edged up to 17.66% (12 month moving average; compared to 17.58% in July 2020 and 17.87% in August 2019).
California remained the #1 state, ahead of Texas with 17.30% (compared to 17.40% in July 2020 and 17.73% in August 2019). Trade through the Atlantic port states was at 30.49% (compared to 30.39% in July 2020 and 29.65% in August 2019). The state’s continued lead in this area forms the trade-related base for one of California’s largest centers of middle-class, blue-collar jobs. While down, Transportation & Warehousing alone provided 625,800 jobs in August (compared to 653,000 in August 2019), paying an average annual salary of $62.0k. This employment base in turn supports additional blue-collar and white-collar jobs in a range of other industries.
California Goods Exports Decrease
-$1.9b
Billion in Exports
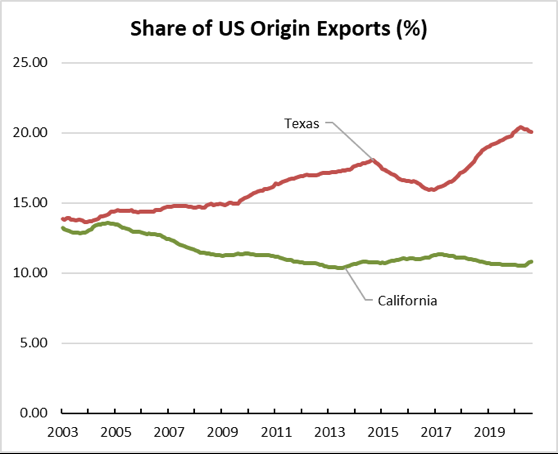
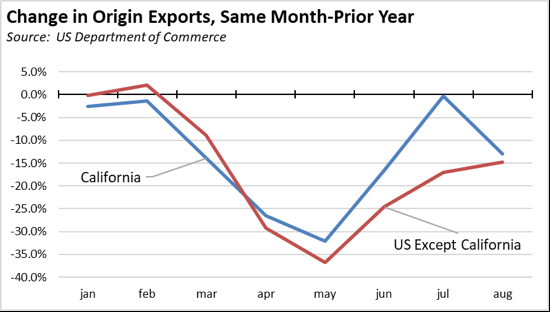
Total California goods exports plunged $1.9 billion from August 2019 (down 12.9%). California remained in 2nd place with 10.79% of all US goods exports (12 month moving total), behind Texas at 20.06%.
Exports for the rest of the US were down even sharper at 14.8%. However, this outcome reflects a continuing trend since the economic crisis began in March. California’s continued reliance on Asian markets combined with a stronger economic recovery in China have shielded some of the state’s export business, while manufacturing levels and related cross-border trade in the supply chains with plants in Canada and Mexico have affected trade numbers in other states.
California's Balance for Goods Trade
-$23.3b
Billion of Goods Trade
California’s balance of goods trade activity through state businesses broadened to -$23.3 billion, compared to a level of -$20.2 billion in August 2019. California trade accounted for 27% of the US trade deficit in goods in August 2020.
Top 20 Exports, August 2020
Top 20 exports by value are shown below, along with the change from August 2019. As the domestic sale of electric vehicles has sagged in California and the rest of the US, Tesla continues to seek export sales in the EU and China to sustain its growth.
By shipping weight (vessel and air total), the leading export was Waste & Scrap at 1.1 billion kg (35% of total exports), followed by Petroleum & Coal Products at 0.7 billion kg (23%), and Other Agricultural Products at 0.2 billion kg (6%).
| Commodity |
Aug 2020 Exports ($b.) |
Change from Aug 2019 |
| Motor Vehicles |
$1.0 |
-7.0% |
| Semiconductors & Other Electronic Components |
0.8 |
-14.1% |
| Navigational/measuring/medical/control Instrument |
0.8 |
-11.5% |
| Industrial Machinery |
0.8 |
39.0% |
| Computer Equipment |
0.7 |
-6.1% |
| Pharmaceuticals & Medicines |
0.7 |
7.8% |
| Fruits & Tree Nuts |
0.6 |
-5.4% |
| Communications Equipment |
0.4 |
-17.2% |
| Aerospace Products & Parts |
0.4 |
-39.2% |
| Waste & Scrap |
0.4 |
15.3% |
| Medical Equipment & Supplies |
0.4 |
-24.7% |
| Miscellaneous Manufactured Commodities |
0.4 |
-46.7% |
| Electrical Equipment & Components, Nesoi |
0.3 |
-12.7% |
| Used Or Second-hand Merchandise |
0.3 |
-22.7% |
| Motor Vehicle Parts |
0.2 |
-15.5% |
| Basic Chemicals |
0.2 |
-15.2% |
| Other General Purpose Machinery |
0.2 |
-14.0% |
| Foods, Nesoi |
0.2 |
-1.4% |
| Motor Vehicle Bodies & Trailers |
0.2 |
24.2% |
| Petroleum & Coal Products |
0.2 |
-58.4% |
|
|
|
Top 10 Export Markets, August 2020
| Country |
Sep 2020 Exports ($b) |
Change from Sep 2019 |
| Mexico |
$2.0 |
-9.6% |
| Canada |
1.5 |
1.5% |
| China |
1.3 |
20.3% |
| Japan |
0.9 |
-6.0% |
| Korea, South |
0.7 |
-7.2% |
| Taiwan |
0.6 |
-16.1% |
| Hong Kong |
0.6 |
-27.4% |
| India |
0.5 |
27.0% |
| Germany |
0.5 |
0.2% |
| Netherlands |
0.4 |
-14.6% |
|
|
|