Below are highlights from the recently released trade data from the US Census Bureau and US Bureau of Economic Analysis. To view additional data and analysis related to the California economy visit our website at www.centerforjobs.org/ca.
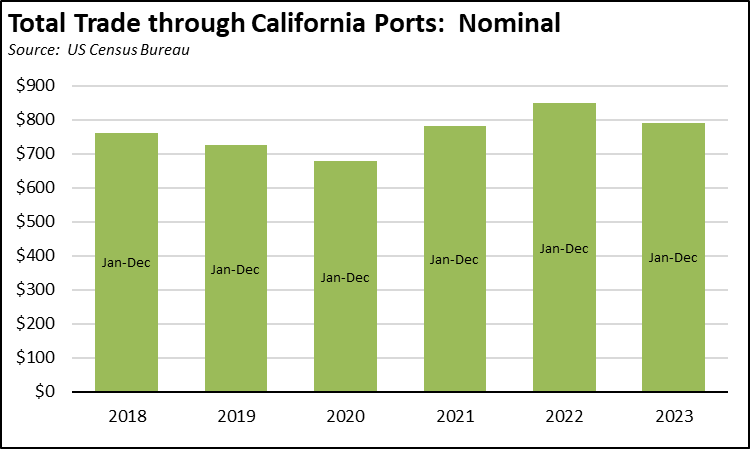
Overall trade flows were largely stable compared to December 2022. Total trade flows through the state’s ports were off by only 0.2% in nominal terms. For the year as a whole, the nominal value of the trade flows was down from 2022, but up slightly compared to 2021 and substantially compared to pre-pandemic 2019.
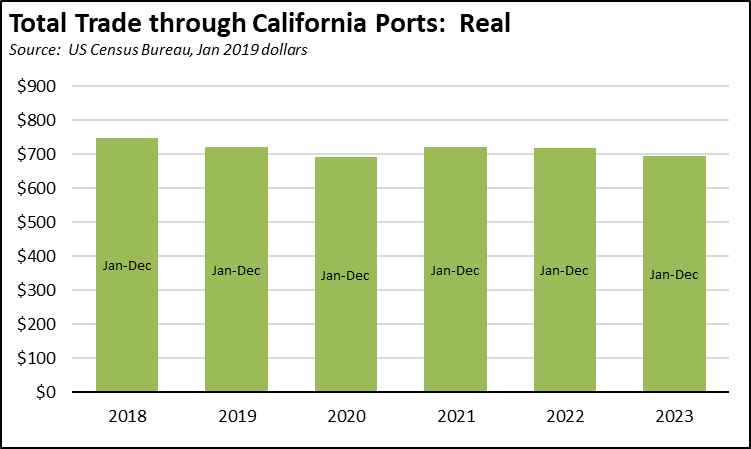
However, above normal inflation, although diminishing, is still with us. In real terms, the 2023 trade flows were essentially flat compared to 2020, up only 0.5%. Compared to 2019, flows were off 3.6% as global trade overall now appears to be softening.
This trend has important implications to the state’s broader income goals. Trade was the only middle-class wage blue-collar industry that grew during the pandemic and that has continued to produce these jobs especially in Southern California. Without Trade jobs to support these income levels, the question remains as to what other industry can. The primary other growth industry producing jobs for workers with a high school diploma or less remains Food & Drinking Places, but these jobs have substantially lower wages and average hours worked per week. The pending increase in the applicable minimum wage effective April 1 is already causing these businesses to restructure their labor needs through operational changes and automation.
The often-vaunted solution of green/clean energy jobs has shown no significant change in the estimated total of around 500,000 jobs statewide, a figure consistently reiterated in reports spanning the past 15 years. However, even if we accept this number, a large share—more than 40% in some of the reports—of these 500,000 positions consist of temporary roles in construction and installation, alongside a considerable portion of preexisting jobs that have been reclassified as part of this category. While the high-tech sector, now apparently undergoing a process of rightsizing as it matures, has traditionally offered well-compensated employment opportunities for individuals with college and graduate degrees, trade has remained instrumental in sustaining middle-class incomes for the broader population.
California Goods Exports
Total California goods exports were down $0.4 billion from December 2022 (down 2.5%). California remained in 2nd place with 8.85% of all US goods exports (12 month moving total), behind Texas at 22.02%.
California Goods Imports
Total California destination goods imports dropped $2.0 billion from December 2022 (down 5.2%).
Top 20 Exports, December 2023
Top 20 exports by value are shown below, along with the change from December 2022.