Below are highlights from the recently released trade data from the US Census Bureau and US Bureau of Economic Analysis. To view additional data and analysis related to the California economy visit our website at www.centerforjobs.org/ca.
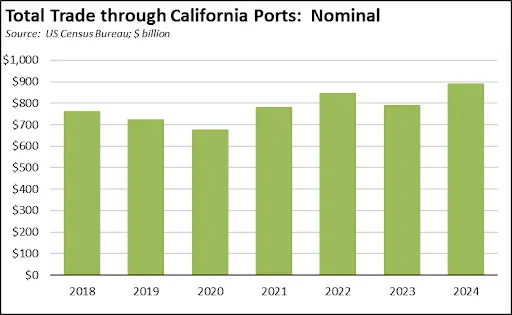
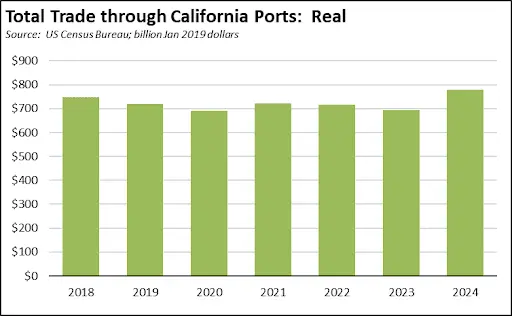
Incorporating the December data, Total Trade through the state’s ports grew to their highest levels in 2024. In nominal terms, Total Trade rose 12.7% over the year and 23.0% compared to pre-pandemic 2019. In real terms, Total Trade was up 12.2% compared to 2023 and 8.1% compared to 2019.
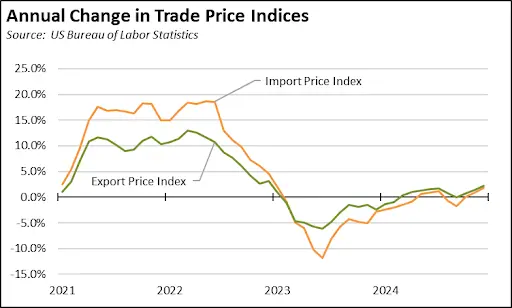
Using the Price Indices for End Use, All Commodities, not seasonally adjusted, trade goods saw minor inflationary pressures at the end of 2024, with import prices rising 2.2% over the year and export prices rising 1.8%. These increases, however, are minor compared to the supply-constraint driven price increases during the pandemic.
Recent tariff activity, however, has raised some uncertainty over the future course of trade good prices, both finished goods and import components and materials for the state’s various industries. Combined, the three countries involved in the recent activity were responsible for 39.6% ($72.6 billion) of the state’s origin exports in 2024, and 41.5% ($203.8 billion) of destination imports.
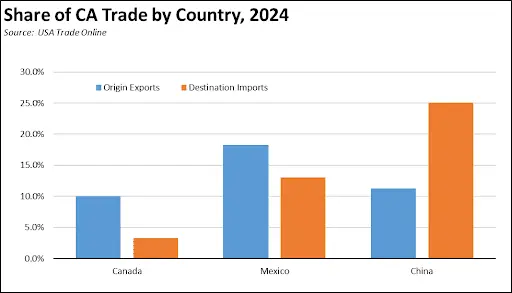
Top three exports to each country were:
- Canada: Computer Equipment, Fruits & Tree Nuts, Communication Equipment
- Mexico: Motor Vehicle Parts, Computer Equipment, Semiconductors & Other Electronic Components
- China (including Hong Kong and Macau): Semiconductors & Other Electronic Components, Commercial & Service Industry Machinery, Navigational/measuring/medical/control Instruments
Top three 2024 destination imports were:
- Canada: Oil & Gas, Grain & Oilseed Milling Products, Meat Products & Meat Packaging Products
- Mexico: Motor Vehicles, Audio & Video Equipment, Fruits & Tree Nuts
- China (including Hong Kong and Macau): Computer Equipment, Miscellaneous Manufactured Commodities, Communications Equipment
California Goods Exports
in Exports
Total California origin goods exports edged up $0.1 billion from December 2023 (up 0.7%). California remained in 2nd place with 8.88% of all US goods exports (12 month moving total), behind Texas at 22.04%.
California Goods Imports
in Imports
Total California destination goods imports grew more sharply by $5.6 billion from December 2023 (up 15.4%).
Top 20 Exports, November 2024
Top 20 exports by value are shown below, along with the change from December 2023.