Download Report Below are highlights from the recently released trade data from the US Census Bureau and US Bureau of Economic Analysis. To view additional data and analysis related to the California economy visit our website at www.centerforjobs.org/ca.
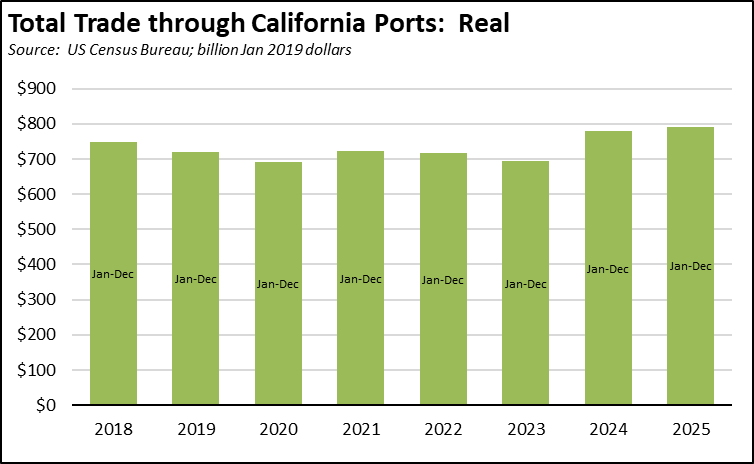
With the December numbers in, California posted new records for trade through the state’s ports measured in both nominal and real terms. California, however, remained in second place with 16.3% of total US trade volume, behind Texas with 19.9% and essentially reversing the relative shares held by each at the beginning of the 2000s.
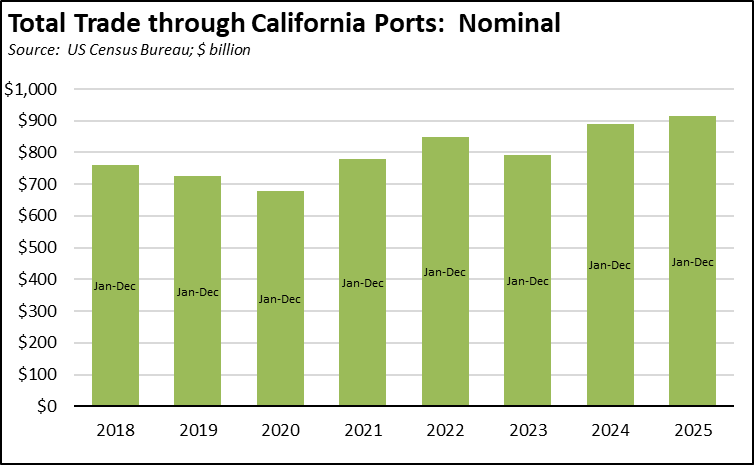
In nominal terms, state exports saw growth in all categories, with non-manufactured commodities (e.g., agriculture) showing the strongest rise. Re-exports shown in the table are goods produced in other states and countries and assembled by California businesses for final export. As with total trade, California remained in second place at 8.65% of total US origin exports, behind Texas with a 19.9% share.
| Goods Exports, Origin of Movement | | | |
|---|
| Source: US Census Bureau; $ billion | | | |
| 2025 | 2024 | Change |
| Manufactured Commodities | $115.1 | $113.0 | 1.9% |
| Share of US Total | 8.5% | 8.6% | - |
| Non-Manufactured Commodities | $24.4 | $22.9 | 6.5% |
| Share of US Total | 6.9% | 6.2% | - |
| Re-exports | $48.9 | $47.5 | 3.0% |
| Total | $188.4 | $183.3 | 2.8% |
| | | |
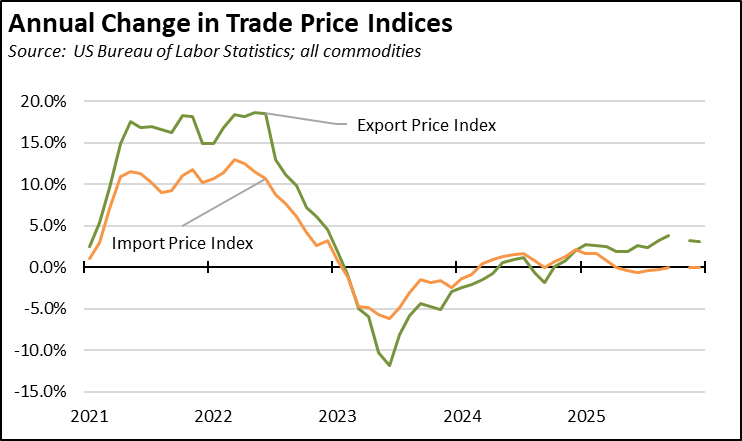
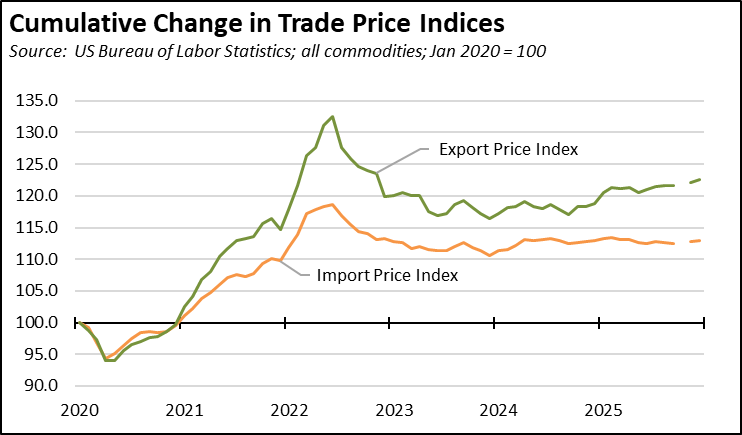
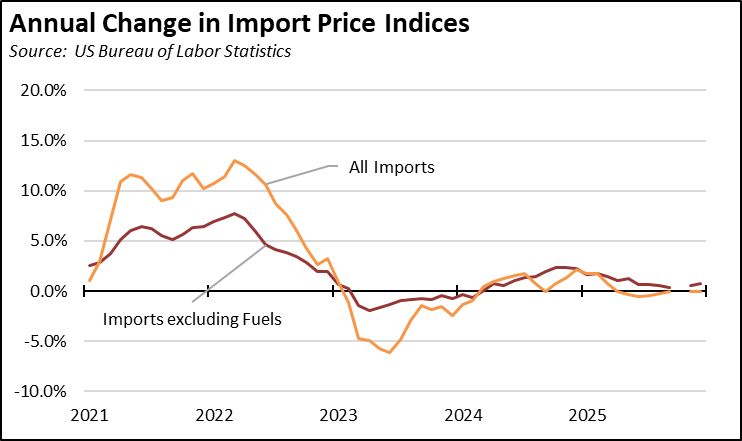
While import prices have recently held steady rather than dropping to accommodate tariff increases, December saw a 0.8% increase over the year for the less volatile imports excluding fuels index. Export prices continued to climb at essentially the same pace over the past 5 months.
Share of Goods through US Ports
16.3%
CA Share of Total Trade
Through US Ports
The share of total US goods trade (exports and imports) through California ports continued falling to 16.35% (12 month moving average; compared to 16.3% in November 2025 and 16.73% in December 2024).
California remained the #2 state, behind Texas which had a 19.91% share (compared to 19.82% in November 2025 and 19.97% in December 2024). Trade through the Atlantic port states was at 30.07% (compared to 30.28% in November 2025 and 29.2% in December 2024). These trade flows form the trade-related base for one of California’s largest centers of middle-class, blue-collar jobs.
California Goods Exports
$0.5
Billion Change
in Exports
Total California origin goods exports were up $0.5 billion from December 2024 (up 3.6%). California remained in 2nd place with 8.65% of all US goods exports (12 month moving total), behind Texas at 20.67%.
California Goods Imports
$5.0
Billion Change
in Imports
Total California destination goods imports grew $5 billion from December 2024 (up 11.8%).
Top 20 Exports, December 2025
Top 20 exports by value are shown below, along with the change from December 2024
| NAICS Commodity | Dec 2025 Exports ($b.) | Change from Dec 2024 |
|---|
| Computer Equipment | $1.9 | 36.4% |
| Fruits & Tree Nuts | 1.4 | 36.4% |
| Semiconductors & Other Electronic Components | 0.9 | 6.8% |
| Aerospace Products & Parts | 0.9 | -14.4% |
| Navigational/measuring/medical/control Instrument | 0.8 | -10.0% |
| Pharmaceuticals & Medicines | 0.7 | 19.6% |
| Communications Equipment | 0.6 | 13.6% |
| Petroleum & Coal Products | 0.6 | 21.3% |
| Medical Equipment & Supplies | 0.5 | 2.8% |
| Electrical Equipment & Components, Nesoi | 0.5 | -23.9% |
| Waste & Scrap | 0.4 | 31.2% |
| Industrial Machinery | 0.4 | -21.7% |
| Commercial & Service Industry Machinery | 0.3 | -16.8% |
| Miscellaneous Manufactured Commodities | 0.3 | -18.5% |
| Other General Purpose Machinery | 0.3 | -15.1% |
| Foods, Nesoi | 0.3 | 4.1% |
| Other Fabricated Metal Products | 0.2 | -9.3% |
| Motor Vehicle Parts | 0.2 | -3.7% |
| Dairy Products | 0.2 | 20.8% |
| Basic Chemicals | 0.2 | -9.7% |
| | |
Top 10 Export Markets, December 2025
| Dec 2025 Exports ($b.) | Change from Dec 2024 |
|---|
| Mexico | $2.6 | 1.1% |
| Canada | 1.3 | -7.2% |
| Taiwan | 1.1 | 18.9% |
| Japan | 0.9 | -5.2% |
| China | 0.9 | -26.0% |
| Korea, South | 0.8 | 5.9% |
| Netherlands | 0.7 | 10.7% |
| Germany | 0.5 | 13.2% |
| Australia | 0.5 | 21.9% |
| Singapore | 0.5 | 11.3% |
| | |