Below are highlights from the recently released trade data from the US Census Bureau and US Bureau of Economic Analysis. To view additional data and analysis related to the California economy visit our website at www.centerforjobs.org/ca.
The trade numbers for California in February in general showed a slowing of activity as concerns over a potential recession remained in play and as the extended labor negotiations remained unresolved. Pacific Merchant Shipping Association reports that inbound traffic (TEUs) at the Port of Los Angeles was the lowest of any February since 2009, and outbound loads the lowest since 2001. Using the more complete January numbers comparing 2023 and 2019, total West Coast port inbound traffic (TEUs) was down 18.9%, East Coast ports up 5.6%, and Gulf Coast ports up 49.1%. The comparable numbers for outbound loads were West Coast dropping 25.7%, East Coast only slightly off at 2.1%, and Gulf Coast up 15.3%.
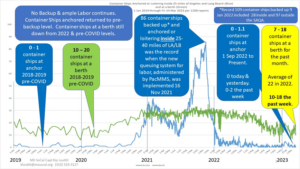
Congestion at the ports has largely faded as a pressing issue, but as indicated in the graphic below from Marine Exchange of Southern California, resolution has come from a decline in traffic. Congestion instead has moved inland as the result of warehouse shortages, issues with other transportation modes, and the state’s ratcheting up of regulatory costs.
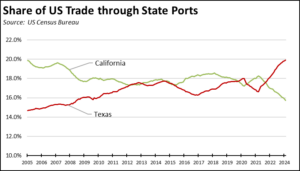
The erosion of California’s competitive trade position is also indicated by the continued drop in overall trade share by value. Using the 12-month moving averages, California continues to drop behind Texas both in terms of share of trade through state ports and origin exports.
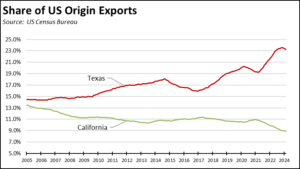
Note that origin exports covers both goods produced in the state as well as goods shipments by California exporters sourced from other locations, and covers the broader jobs base involved in goods exports.
Share of Goods through US Ports
Through US Ports
The share of total US goods trade (exports and imports) through California ports continued dropping to 15.72% (12 month moving average; compared to 15.90% in January 2023 and 16.93% in February 2022).
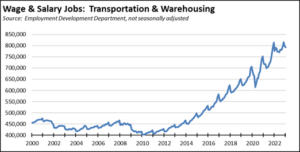
California remained the #2 state, behind Texas with 19.92% (compared to 19.83% in January 2023 and 18.32% in February 2022). Trade through the Atlantic port states was at 29.74% (compared to 29.64% in January 2023 and 30.02% in February 2022). While the state’s overall share is eroding, trade-related jobs remain one of the core blue collar, middle class wage job centers for the state. In February 2023,Transportation & Warehousing alone provided 793,200 wage & salary jobs, essentially level (+1,400) compared to February 2022, but still well above prior years. Moving both goods and people, this industry was the sole one showing substantial expansion in blue collar jobs during the pandemic years.
California Goods Exports
Total California goods exports were down $1.2 billion from February 2022 (down 8%). California remained in 2nd place with 8.89% of all US goods exports (12 month moving total), behind Texas at 23.27%. In current dollars, exports were down $0.9 billion (down 6.4%) compared to pre-pandemic February 2019, but were down 16.4% after adjusting for inflation.
California Goods Imports
Total California destination goods imports were down more sharply, dropping $7.6 billion compared to February 2022 (down 19.3%). In current dollars, imports were up $2.5 billion (up 9.6%) compared to pre-pandemic February 2019, but were off slightly by 3.1% after adjusting for inflation.
Top 20 Exports, February 2023
Top 20 exports by value are shown below, along with the change from February 2022.