Below are highlights from the recently released trade data from the US Census Bureau and US Bureau of Economic Analysis. To view additional data and analysis related to the California economy visit our website at www.centerforjobs.org/ca.
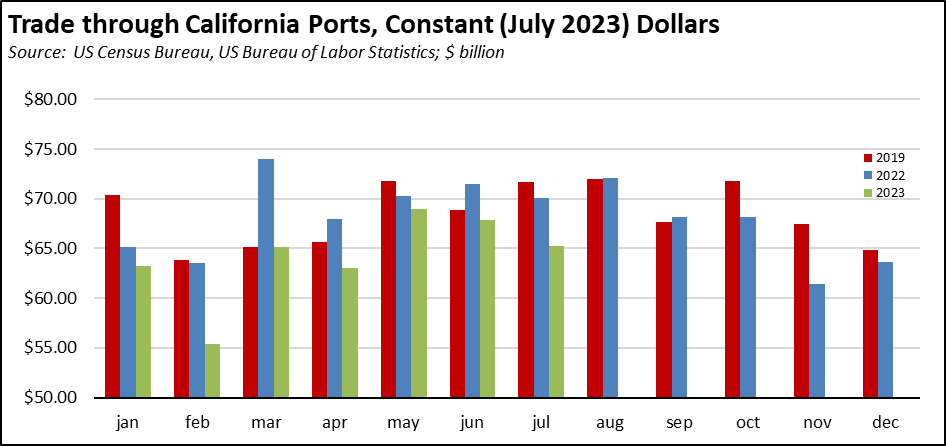
In July, the trade numbers for California showed the combined effect of the extended labor negotiations along with declining economic activity in China. In nominal terms, origin exports were down 8.6% compared to the prior year, and destination imports down more sharply at 16.2%. Overall trade flows through the state’s ports were off 11.7%.
In real terms, total trade through California ports has been down in every month so far this year compared to 2022 levels, and down in every month except March when compared to pre-pandemic 2019.
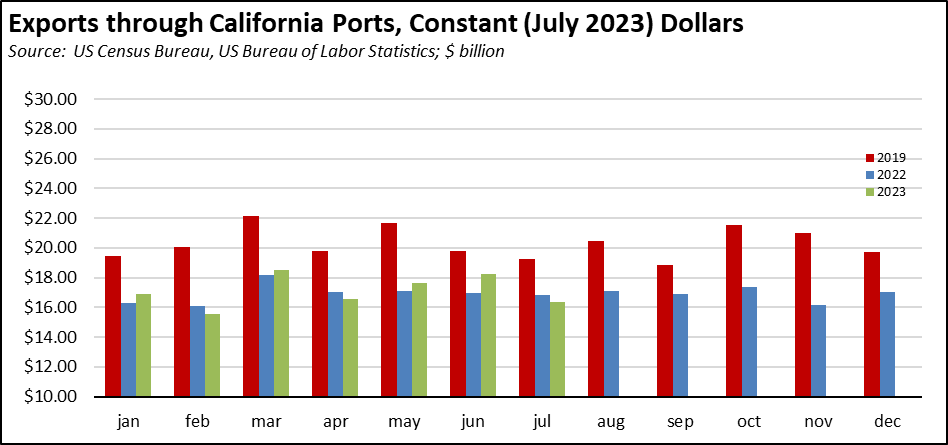
Export flows have been somewhat more variable but have tracked more closely to the 2022 results. Export activity, however, remains well below recovery levels when compared to 2019.
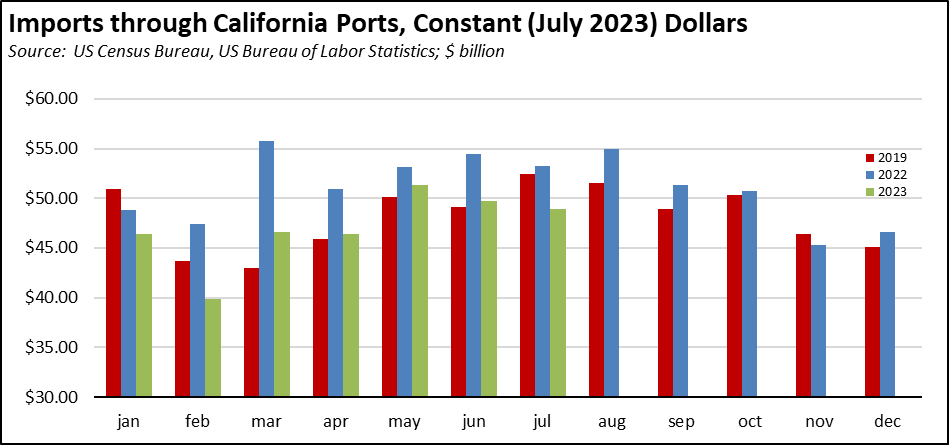
Import flows have been running below 2022, but in the prior 4 months were above the 2019 activity. July saw a reversal of this trend.
The combined effects of the extended labor uncertainty, pandemic congestion, rising costs due to state and regional regulations, and the diversifying shift away from a reliance on China sourcing has seen a continuous erosion in the previous dominance of California as the nation’s leading trade gateway. California has seen its share of total US trade drop from over a fifth in 2004, to the current level of just over 15% and continuing to drop on a 12-month moving basis. Currently, the primary mitigating factor slowing this shift has been drought in Panama limiting the shift to trade routes through the Canal.
Over the past few decades, economic development in California has taken two decidedly different tracks. Following the economic disruptions in the early 1990s, the Bay Area turned to tech and its higher wage jobs promoting an expansion in upper income households. Southern California in contrast developed its trade base, promoting instead middle-class wage jobs especially to blue collar households. The resulting outcomes have had profoundly different effects on income opportunities and the state’s professed interests in combating income inequality.
The recent ratification of the new West Coast labor agreement removes one barrier as the ports now turn to efforts to regain the lost market share that underpins this critical jobs and income base. The regulatory agencies, however, continue to throw up roadblocks, including state policies that push energy costs ever higher even as other state and local policies push greater electrification of port activities, and in the latest attempt which would impose a cap on overall trade flows and the middle class wage jobs base in Southern California.
California Goods Exports
Total California goods exports were down $1.3 billion from July 2022 (down 8.6%). California remained in 2nd place with 8.84% of all US goods exports (12 month moving total), behind Texas at 22.36%.
California Goods Imports
Total California destination goods imports plunged $7.1 billion from July 2022 (down 16.2%).
Top 20 Exports, July 2023
Top 20 exports by value are shown below, along with the change from July 2022.