Below are highlights from the recently released trade data from the US Census Bureau and US Bureau of Economic Analysis. To view additional data and analysis related to the California economy visit our website at www.centerforjobs.org/ca.
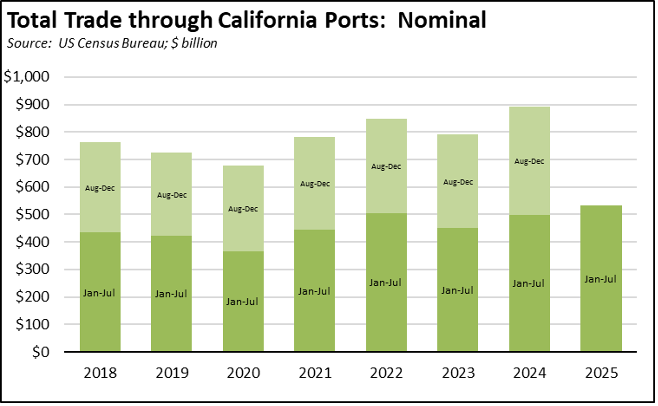
Total trade through the state’s ports in July rose 11.1% compared to June and 3.9% compared to July 2024, reversing the small dips seen in the prior two months. State origin exports continued their rise for every month so far in 2025 (comparing same month, prior year) at a gain of 5.9%, while destination imports again saw a loss, at 4.6%.
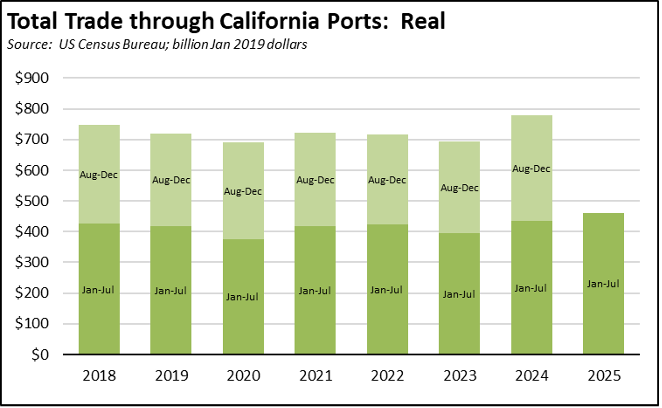
Overall, trade through the state’s ports remained well ahead of prior years for the period Jan-Jul, measured in both nominal and real terms.
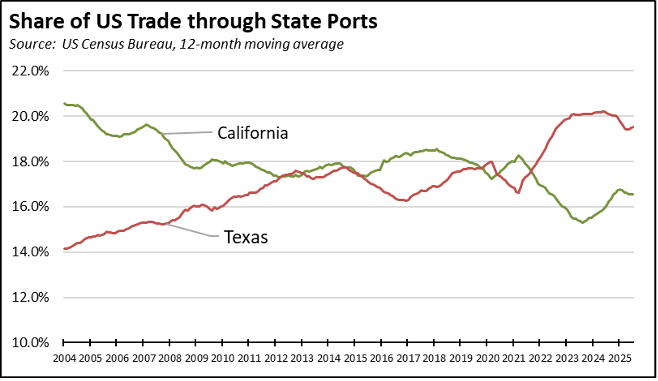
In part responding to last year’s disruptions at the Gulf and East Coast ports, California’s share of total US trade activity has shown some recovery from its longer term decline due to increasing competition from those ports. California, however, still remains well behind Texas.
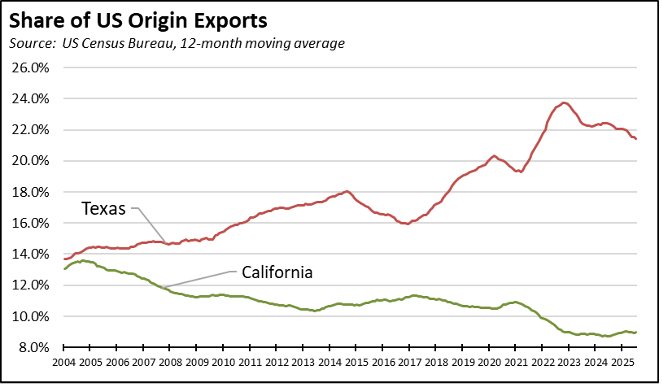
In part reflecting the diminishing size of the state’s manufacturing base, California’s share of the US origin exports has shown little change since 2022.
Trade prices again showed little change from prior months, with export prices again running somewhat higher than imports.
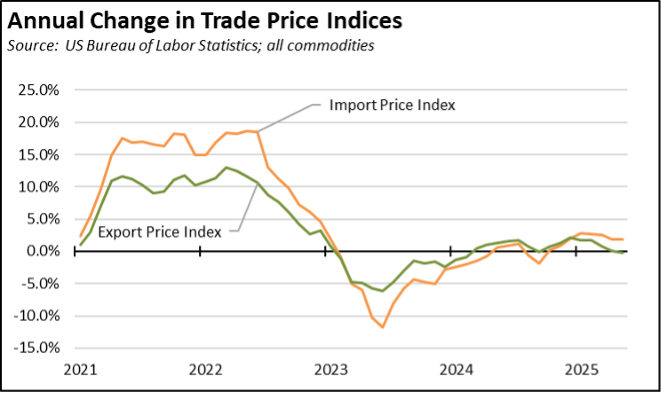

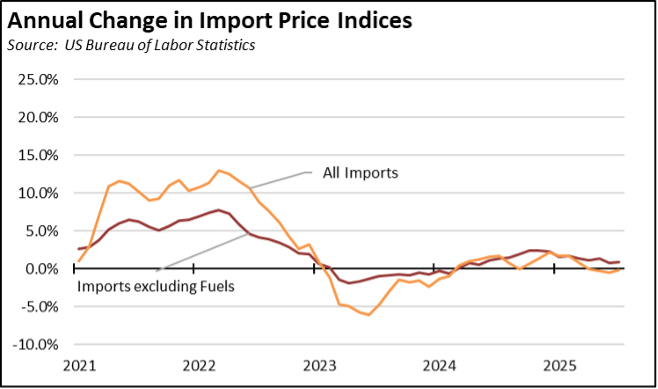
The import indices shown in the charts above, however, include all commodities including the more volatile fuel components. Removing this element, however, still shows few differences in recent months. On an annualized basis, import prices for all commodities rose 0.1% in the first 7 months, while import prices for all commodities excluding fuels rose 0.7%. While tariffs may be affecting prices paid by end users (because tariffs are paid by the importer), these effects are not yet showing up in the underlying prices for the imported goods.
California Goods Exports
in Exports
Continuing the gains in every month so far in 2025, total California origin goods exports rose $0.9 billion from July 2024 (up 5.9%). California remained in 2nd place with 8.96% of all US goods exports (12 month moving total), behind Texas at 21.42%.
California Goods Imports
in Imports
Showing losses for the fourth month in a row, total California destination goods imports dropped $2.1 billion from July 2024 (down 4.6%).
Top 20 Exports, July 2025
Top 20 exports by value are shown below, along with the change from Jul 2024.
Top 10 Export Markets, July 2025
The biggest export market losses were seen in China and Canada, while California exports rose or were little changed in most of the other Top 10 markets.