Download Report
Below are highlights from the recently released trade data from the US Census Bureau and US Bureau of Economic Analysis. To view additional data and analysis related to the California economy visit our website at www.centerforjobs.org/ca.
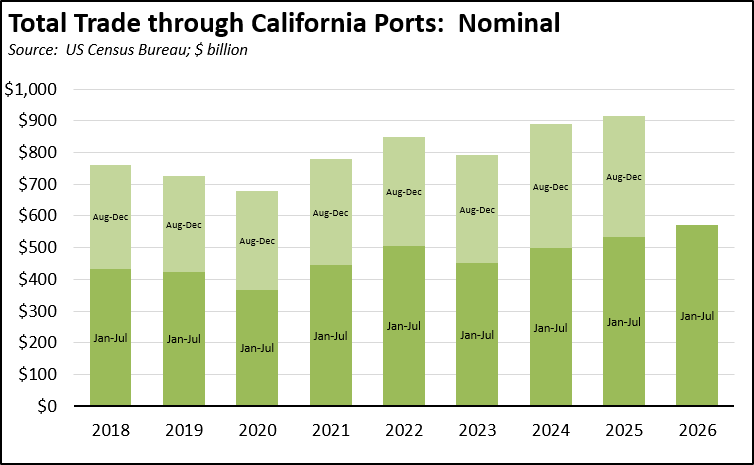
In July, total trade through the state’s ports rose $7.7 billion (9.3%) compared to July 2025, and by $4.9 billion (5.6%) compared to the prior month. Imports continue to surge due to a confluence of several factors, including early holiday shipments especially by smaller and medium-sized firms in an effort to bypass tariffs and fuel-driven transport costs, shippers bypassing the Suez Canal due to conflict in the Middle East, and draft limits issued for the Panama Canal in anticipation of El Niño-related droughts. Year-to-date trade levels remain well ahead of prior years in nominal terms.
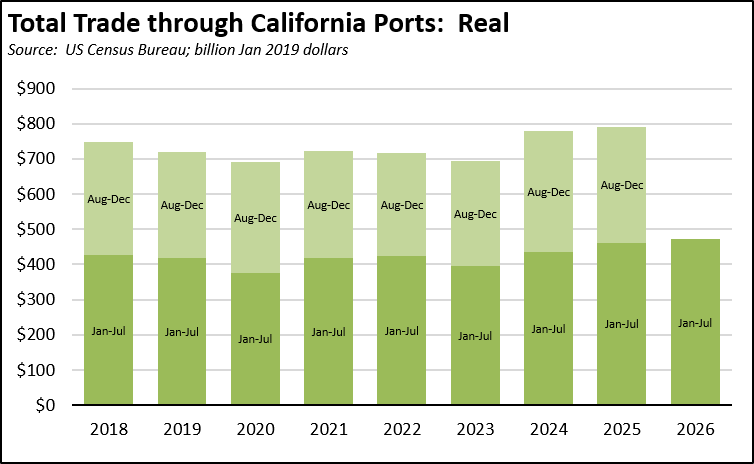
And in real terms as well.
In nominal terms, origin exports showed little change, off $0.3 billion (-1.8%) compared to the prior month and up only $0.2 billion (1.1%) compared to the same month last year. Both, however, showed declines in real terms.
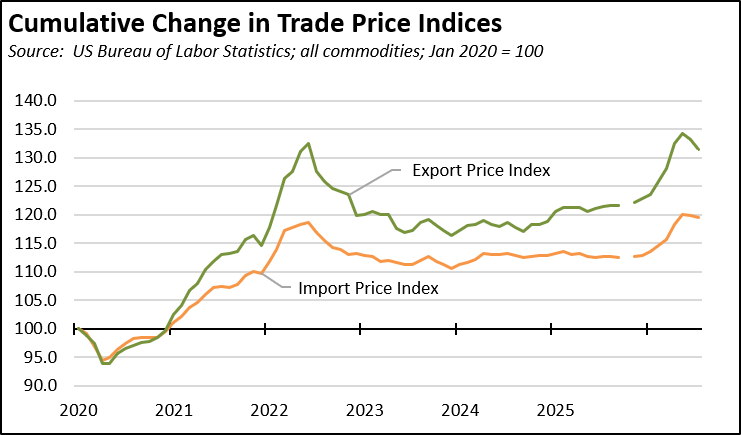
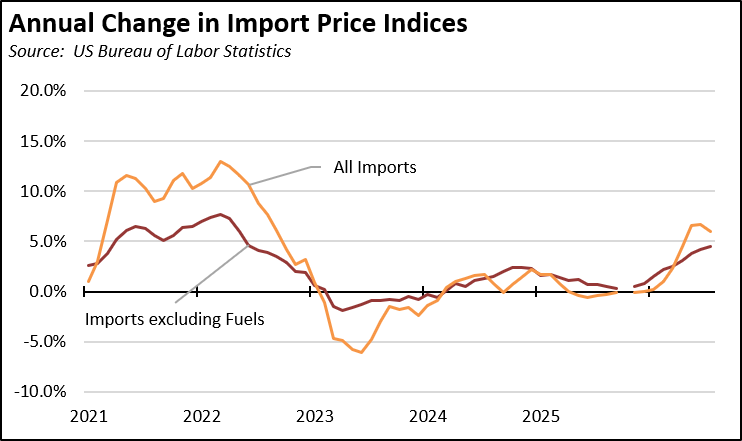
The growth in the trade price indices slowed somewhat, with import prices down 4.7% in July on an annualized basis but still up 5.9% over the year. Stripping out the more volatile energy component, import prices were up 4.5% both for the annualized rate for the month and over the prior 12 months.

Share of Goods through US Ports
16.4%
CA Share of Total Trade
Through US Ports
The share of total US goods trade (exports and imports) through California ports notched down to 16.44% (12 month moving average; compared to 16.48% in June 2026 and 16.57% in July 2025).
California remained the #2 state, behind Texas which had a 21.62% share (compared to 21.4% in Jun 2026 and 19.47% in Jul 2025). Trade through the Atlantic port states was at 27.87% (compared to 28.3% in Jun 2026 and 30.16% in Jul 2025). These trade flows form the trade-related base for one of California’s largest centers of middle-class, blue-collar jobs.
California Goods Exports
$0.2
Billion Change in Exports
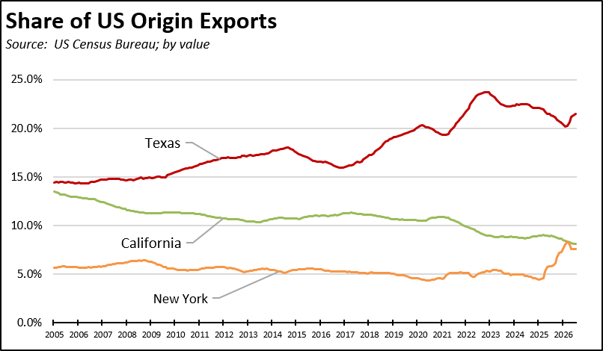
Total California origin goods exports were up $0.2 billion from July 2025 (up 1.1%). California remained in 2nd place with 8.1% of all US goods exports (12 month moving total), behind Texas at 21.44%.
While California remained in second place, New York continues to challenge for this ranking.
California Goods Imports
$8.1
Billion Change in Imports
Total California destination goods imports grew $8.1 billion from July 2025 (up 18.7%).
Origin Exports, July 2026
All Origin Exports by 3-digit NAICS and by value are shown below, along with the change from Jul 2025.
| NAICS Commodity | Jul 2026 Exports ($b.) | Change from Jul 2025 |
|---|
| Computer & Electronic Products | $4.6 | -3.3% |
| Chemicals | 1.6 | 18.3% |
| Machinery, Except Electrical | 1.5 | 14.3% |
| Agricultural Products | 1.4 | 15.9% |
| Transportation Equipment | 1.2 | -38.4% |
| Food & Kindred Products | 0.9 | 0.1% |
| Electrical Equipment, Appliances & Components | 0.9 | 21.3% |
| Miscellaneous Manufactured Commodities | 0.8 | -2.7% |
| Fabricated Metal Products, Nesoi | 0.5 | 15.5% |
| Petroleum & Coal Products | 0.5 | -4.7% |
| Waste & Scrap | 0.4 | 26.9% |
| Primary Metal Mfg | 0.3 | 43.4% |
| Plastics & Rubber Products | 0.3 | 6.3% |
| Used or Second-Hand Merchandise | 0.2 | 0.1% |
| Other Special Classification Provisions | 0.1 | 10.0% |
| Apparel & Accessories | 0.1 | -7.4% |
| Oil & Gas | 0.1 | 32.8% |
| Nonmetallic Mineral Products | 0.1 | 32.3% |
| Paper | 0.1 | -2.1% |
| Beverages & Tobacco Products | 0.1 | -20.1% |
| Wood Products | 0.0 | -4.5% |
| Furniture & Fixtures | 0.0 | 13.2% |
| Textiles & Fabrics | 0.0 | -9.1% |
| Printed Matter & Related Products, Nesoi | 0.0 | 34.1% |
| Minerals & Ores | 0.0 | -23.5% |
| Leather & Allied Products | 0.0 | -15.9% |
| Textile Mill Products | 0.0 | -10.5% |
| Fish, Fresh/Chilled/Frozen & Other Marine Products | 0.0 | -23.9% |
| Livestock & Livestock Products | 0.0 | 60.2% |
| Forestry Products, Nesoi | 0.0 | -4.1% |
| Products Supporting Agriculture & Forestry | 0.0 | 166.3% |
| Goods Returned (Exports for Canada Only) | 0.0 | -16.0% |
| Total, All Commodities | 16.1 | 1.1% |
| | |
Top 10 Export Markets, July 2026
| <br />
| Jul 2026 Exports ($b.) | Change from Jul 2025 |
|---|
| Mexico | $2.9 | -1.8% |
| Canada | 1.5 | 15.4% |
| Taiwan | 1.2 | -24.8% |
| Japan | 0.9 | 3.9% |
| China | 0.9 | 13.2% |
| Netherlands | 0.8 | -0.3% |
| Korea, South | 0.7 | -4.2% |
| South America | 0.6 | 40.8% |
| Singapore | 0.6 | 2.9% |
| Malaysia | 0.6 | 9.4% |
| | |
