Below are highlights from the recently released trade data from the US Census Bureau and US Bureau of Economic Analysis. To view additional data and analysis related to the California economy visit our website at www.centerforjobs.org/ca.
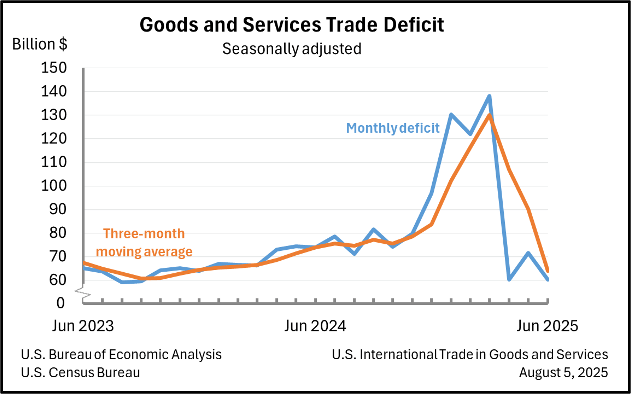
Trade statistics in June again were buffeted by tariff policy shifts, with the latest deadline for tariff agreements now set for August 7. Trade levels consequently have been affected more by timing decisions attempting to beat the latest deadlines rather than pure economic considerations. For example, the dramatic shift in imports between the first and second quarters was more a redistribution of when those imports took place rather than a shift in the overall levels. This factor continued in June, when nationally the goods and services trade deficit fell 16.0% as exports eased more slowly (-0.5%) than imports (-3.7%). With the number of trade agreements ramping up, a level of certainty if not yet stability is beginning to enter the trade picture, but the outcome of this week’s latest deadline along with other recent moves such as the announced intention to impose secondary tariffs related to Russia will shed more light on expected trade levels during what would normally be the holiday shipping peaks. The trade uncertainty, however, has yet to have substantial effects on the economy including jobs and prices, particularly as many companies to date have absorbed much of the resulting costs and as reshoring investments in many cases remain premature given this continuing uncertain investment climate. As additional agreements are completed and the longer-term cost picture becomes more apparent, both of these outcomes are likely to change, with some additional tariff costs passed onto customers and investments again being assessed with at least this source of risk narrowed.
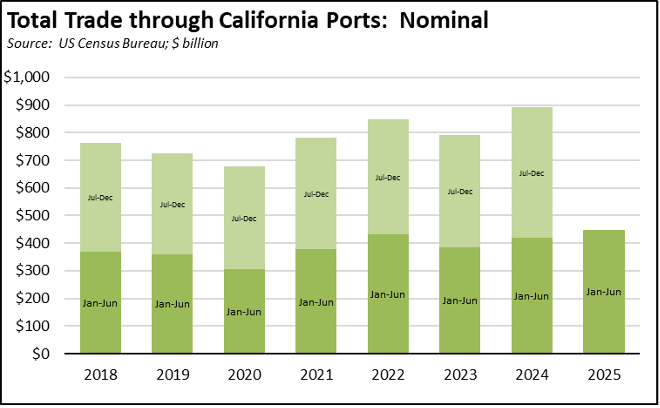
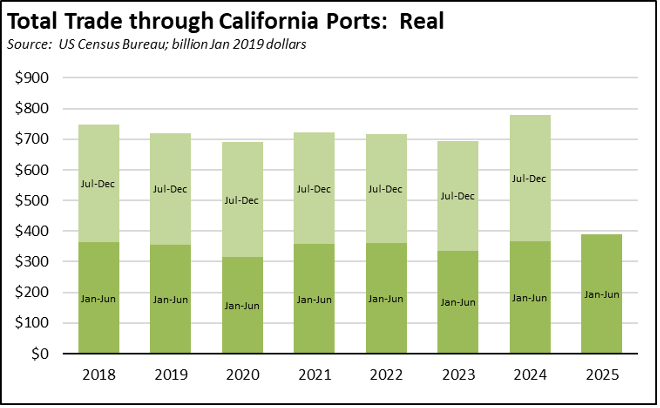
For California, goods trade through the state’s ports eased only $0.7 billion (-1.0%) in nominal terms from June 2024 but rose $2.6 billion (3.6%) compared to the previous month. Year-to-date trade activity levels again showed improvement over prior years in both nominal and real terms.
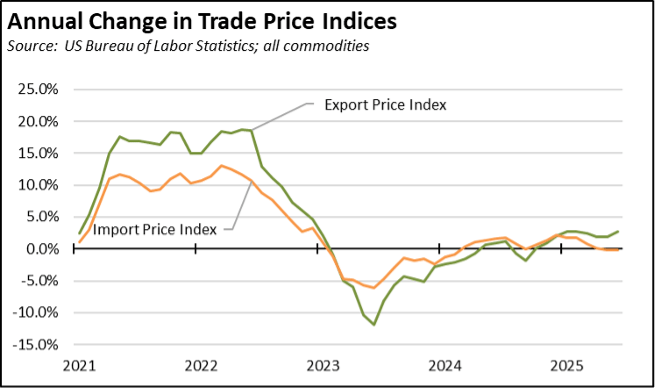
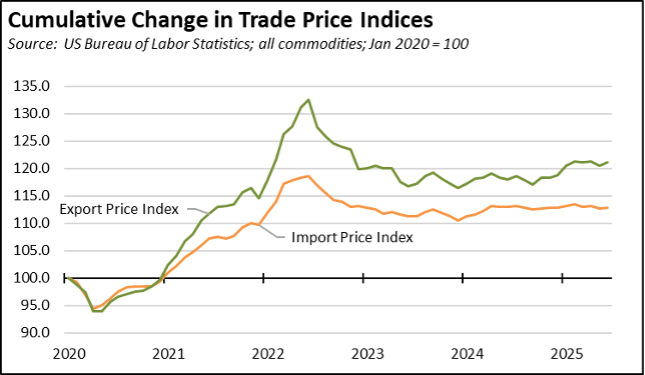
Export price levels have seen some growth in the past few months, but both exports and imports overall have shown little change so far this year. Note that previous versions of the Annual Change chart below were mislabeled and have been corrected in this version.
California Goods Exports
in Exports
Total California origin goods exports were essentially unchanged, up only $0.02 billion from June 2024 (up 0.1%). California remained in 2nd place with 8.94% of all US goods exports (12 month moving total), behind Texas at 21.54%.
California Goods Imports
in Imports
Total California destination goods imports fell $1.7 billion from June 2024 (down 3.9%).
Top 20 Exports, June 2025
Top 20 exports by value are shown below, along with the change from Jun 2024.