
Below are highlights from the recently released trade data from the US Census Bureau and US Bureau of Economic Analysis. To view additional data and analysis related to the California economy visit our website at www.centerforjobs.org/ca.
In June, total trade through the state’s ports was up 5.6% in nominal terms compared to the prior month and 14.9% compared to the same month a year ago as imports continued to surge. As with prior months in the year to date, however, total trade was up in nominal terms but was little change in real terms.
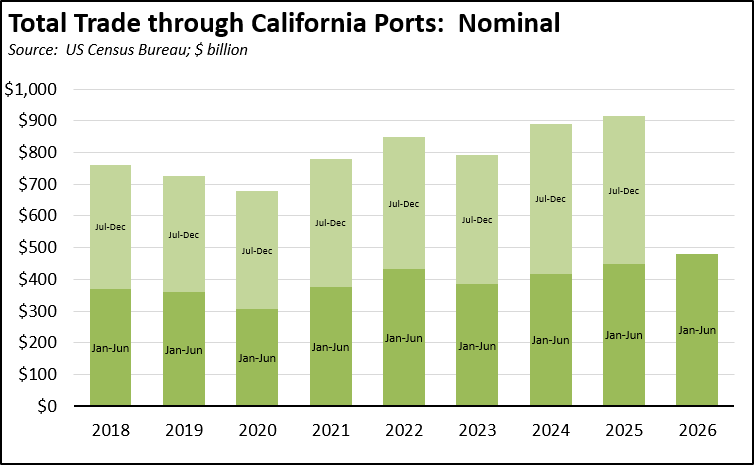
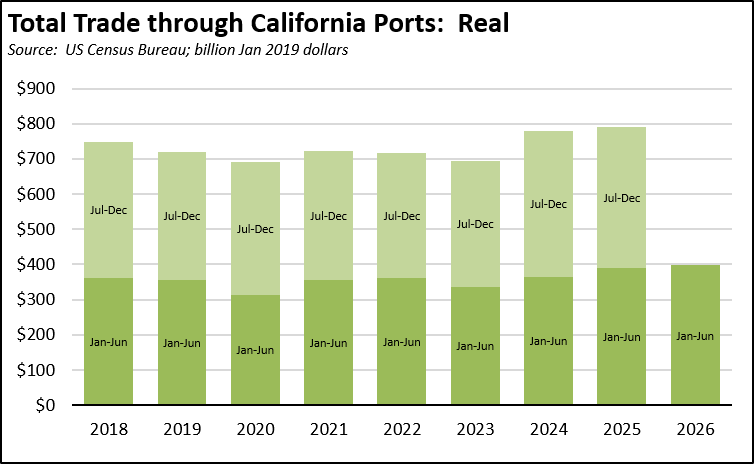
In nominal terms, origin exports were down 2.0% compared to May and up 4.8% compared to June 2025. In real terms, however, exports were off 4.9% for the year. On a 12-month moving average, California’s share of total US exports continued to notch down to 8.16%, while New York continued its challenge to move into the 2nd place slot by notching up to 7.62%.
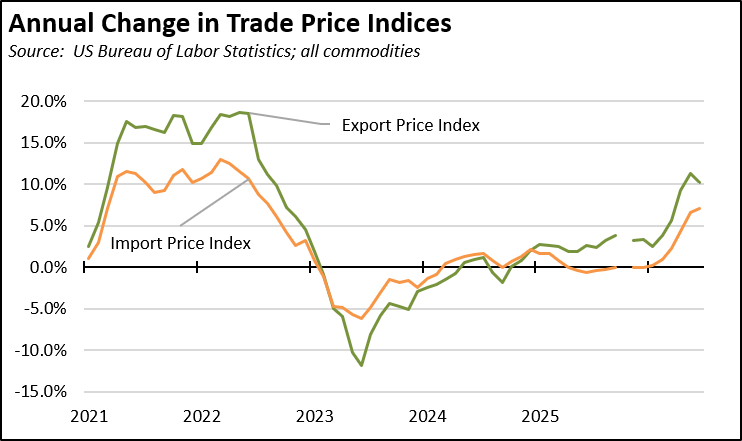
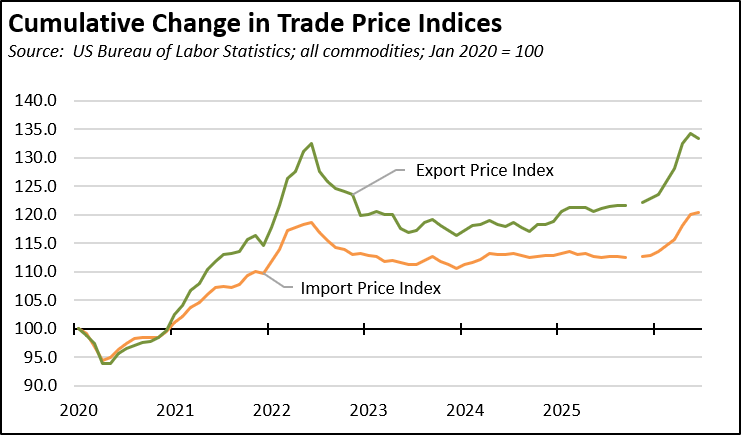
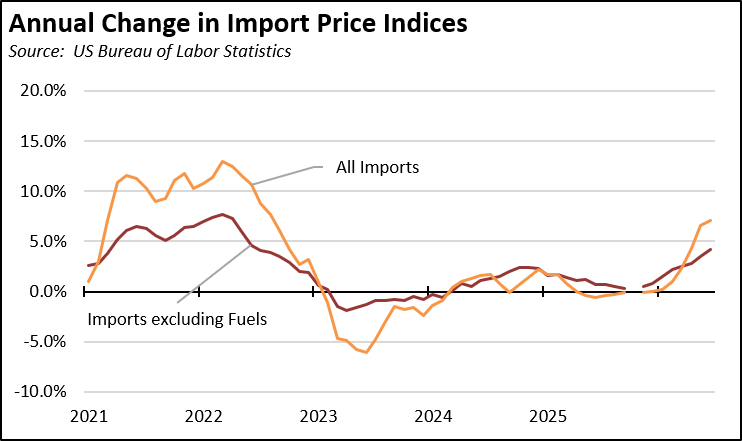
The rise in import prices (all goods) eased substantially in June, rising 4.1% on an annualized basis for the month but still growing 7.1% over the year. Stripping out the more volatile energy component, import prices still rose 4.5% for the month and 4.2% for the year. Export prices, on the other hand, fell 6.9% on an annualized basis for the month but still saw a stronger gain of 10.2% for the year.
California Goods Exports
Total California origin goods exports rose $0.8 billion in nominal terms from June 2025 (up 4.8%). California remained in 2nd place with 8.16% of all US goods exports (12 month moving total), behind Texas at 21.34%.
California Goods Imports
Total California destination goods imports surged $7.4 billion from June 2025 (up 18.2%).
Top 20 Exports, June 2026
Top 20 exports by value are shown below, along with the change from Jun 2025.