Download Report Below are highlights from the recently released trade data from the US Census Bureau and US Bureau of Economic Analysis. To view additional data and analysis related to the California economy, visit our website at www.centerforjobs.org/ca.
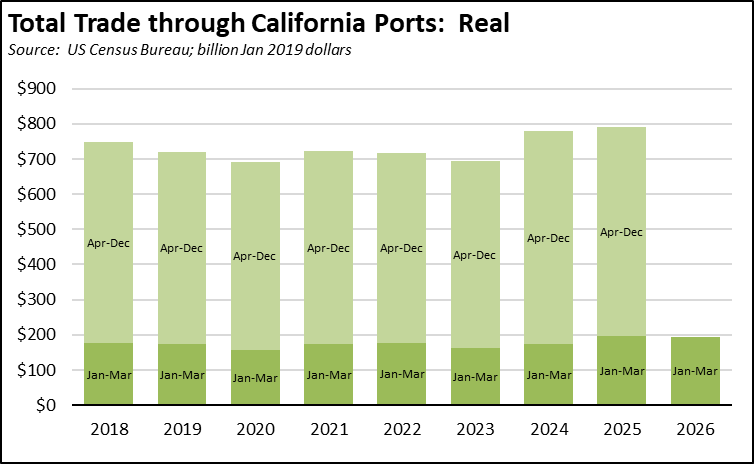
Total trade through the state’s ports in the first quarter was little changed compared to the same period in 2025 in both nominal and real terms, but also remaining well ahead of trade flows in the prior years.
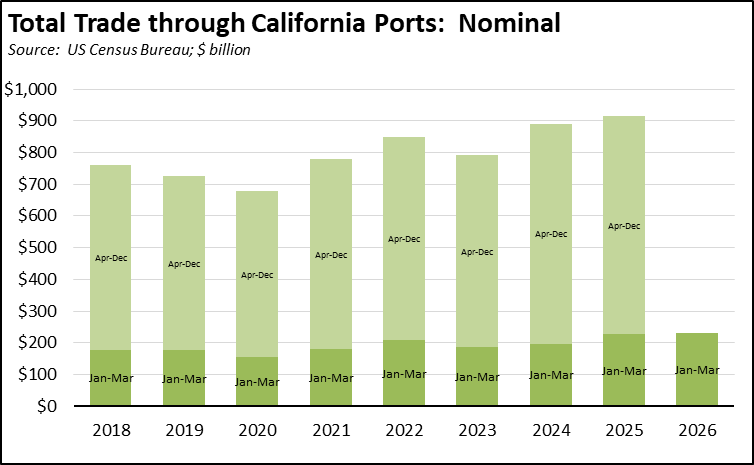
State origin exports were up $2.1 billion (13.5%) compared to the prior month and $0.7 billion (4.2%) compared to March 2025. Destination imports were up more sharply, at $7.6 billion (21.6%) for the month and $2.3 billion (5.6%) compared to March 2025.
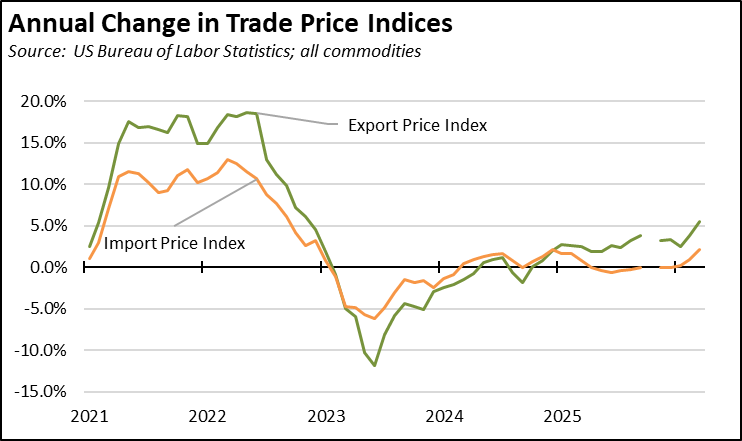
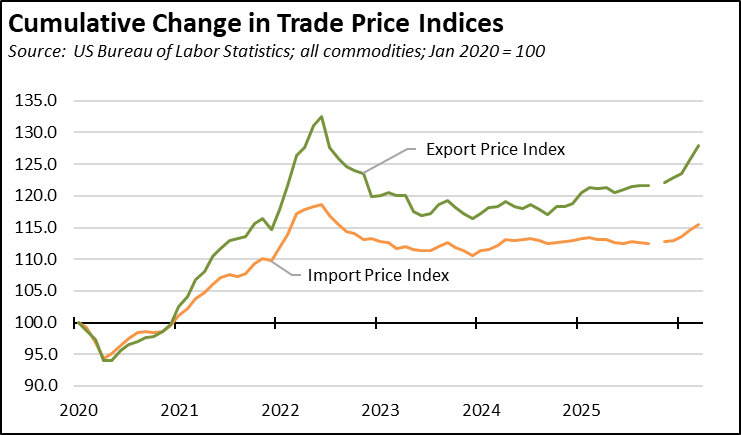
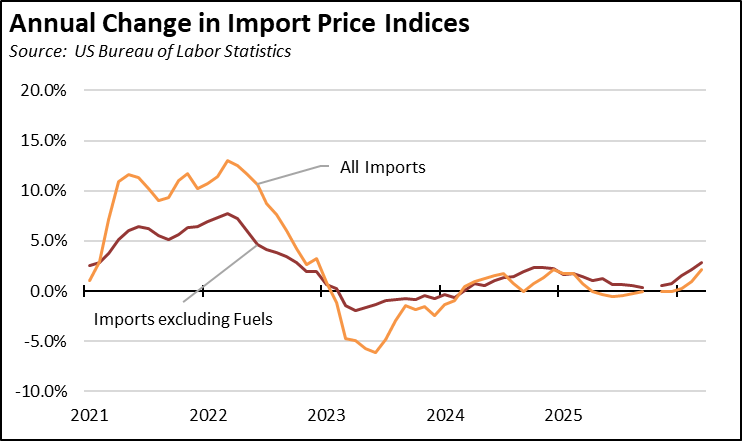
Trade prices also saw a jump although slightly moderated from February’s large increases. On an annualized basis, the export price index (all goods) rose 21.6% in March and the import price index (all goods) rose 9.6%. The import price index for all goods except the more volatile fuels component also rose sharply at an annualized rate of 7.5%.
Share of Goods through US Ports
16.6%
CA Share of Total Trade
Through US Ports
The share of total US goods trade (exports and imports) through California ports edged up to 16.56% (12 month moving average; compared to 16.42% in February 2026 and 16.63% in March 2025).
California remained the #2 state, behind Texas which had a 20.64% share (compared to 20.39% in February 2026 and 19.46% in March 2025). Trade through the Atlantic port states was at 29.19% (compared to 29.46% in February 2026 and 29.88% in March 2025). These trade flows form the trade-related base for one of California’s largest centers of middle-class, blue-collar jobs.
California Goods Exports
$0.7
Billion Change
in Exports
Total California origin goods exports were up $0.7 billion from March 2025 (up 4.2%). California remained in 2nd place with 8.37% of all US goods exports (12 month moving total), behind Texas at 20.3%.
California Goods Imports
$2.3
Billion Change
in Imports
Total California destination goods imports grew $2.3 billion from March 2025 (up 5.6%).
Top 20 Exports, March 2026
Top 20 exports by value are shown below, along with the change from Mar 2025.
| NAICS Commodity | Mar 2026 Exports ($b.) | Change from Mar 2025 |
|---|
| Computer Equipment | $2.2 | 34.0% |
| Fruits & Tree Nuts | 1.4 | 34.3% |
| Semiconductors & Other Electronic Components | 0.9 | 22.9% |
| Aerospace Products & Parts | 0.9 | -4.4% |
| Navigational/measuring/medical/control Instrument | 0.9 | -5.8% |
| Pharmaceuticals & Medicines | 0.9 | -1.8% |
| Communications Equipment | 0.7 | 11.8% |
| Medical Equipment & Supplies | 0.5 | -5.4% |
| Waste & Scrap | 0.5 | 33.4% |
| Industrial Machinery | 0.5 | 0.9% |
| Electrical Equipment & Components, Nesoi | 0.4 | -23.8% |
| Petroleum & Coal Products | 0.4 | -23.8% |
| Commercial & Service Industry Machinery | 0.4 | -8.2% |
| Nonferrous (exc Alum) & Processing | 0.4 | 115.5% |
| Used Or Second-hand Merchandise | 0.3 | -16.5% |
| Motor Vehicle Parts | 0.3 | -7.2% |
| Other Fabricated Metal Products | 0.3 | 6.4% |
| Miscellaneous Manufactured Commodities | 0.3 | -37.7% |
| Other General Purpose Machinery | 0.3 | -31.1% |
| Electrical Equipment | 0.3 | 9.6% |
| | |
Top 10 Export Markets, March 2026
| f | Mar 2026 Exports ($b.) | Change from Mar 2025 |
|---|
| Mexico | $2.8 | -11.8% |
| Canada | 1.3 | -23.9% |
| Taiwan | 1.3 | 25.1% |
| Japan | 1.0 | 6.2% |
| Korea, South | 1.0 | 18.6% |
| China | 0.9 | -5.4% |
| Netherlands | 0.8 | 29.2% |
| Singapore | 0.7 | 67.4% |
| Germany | 0.6 | 20.8% |
| United Kingdom | 0.6 | -9.1% |
| | |