Below are highlights from the recently released trade data from the US Census Bureau and US Bureau of Economic Analysis.
The November trade numbers saw a general decline as pandemic period patterns began to reverse and as China experienced continued lockdowns. Total trade through the state’s ports dropped both in nominal and real terms from November 2021, and was down in real terms compared to pre-pandemic November 2019. Origin exports were down 1.0% nominal (-3.5% real) from the prior year, and down 0.3% nominal (-12.2% real) from November 2019. Destination imports fell more sharply, down 10.6% (-12.9% real) from the prior year, but saw little change in real terms (down 2.5%) from November 2019.
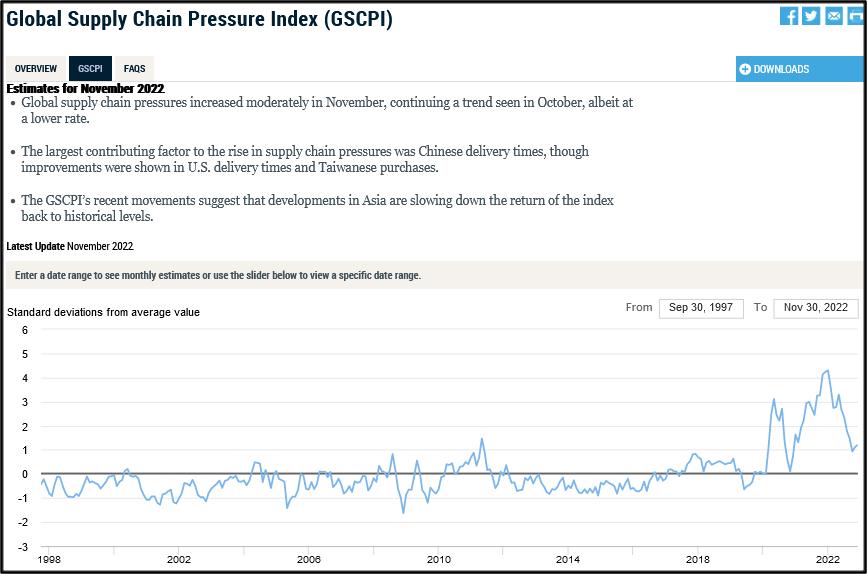
The drop in trade activity was also seen in the continued easing in supply chain congestion. In their latest report, Marine Exchange of Southern California indicates the San Pedro Bay ports have remained free of backups since November 22. The situation has in fact reversed with the ports now reporting open berths. Globally, similar easing has come from declining trade levels. The New York Federal Reserve’s Global Supply Chain Pressure Index remains somewhat elevated due to continued factors in Asia, but is down sharply from its peak in December 2021.
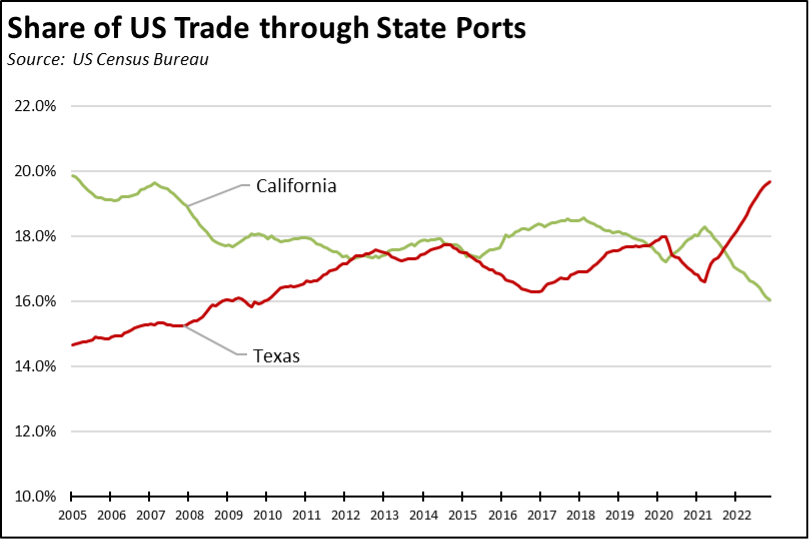
Congestion relief at the state’s ports, however, is also due to what appears to be a shift in trade patterns. California is losing its previous dominant position in part due to continuing concerns over the unresolved West Coast port worker negotiations and in part due to growing costs due to inland supply chain congestion and state regulations. The state’s share of total US trade activity is seeing a basic shift being played out between California and Texas.
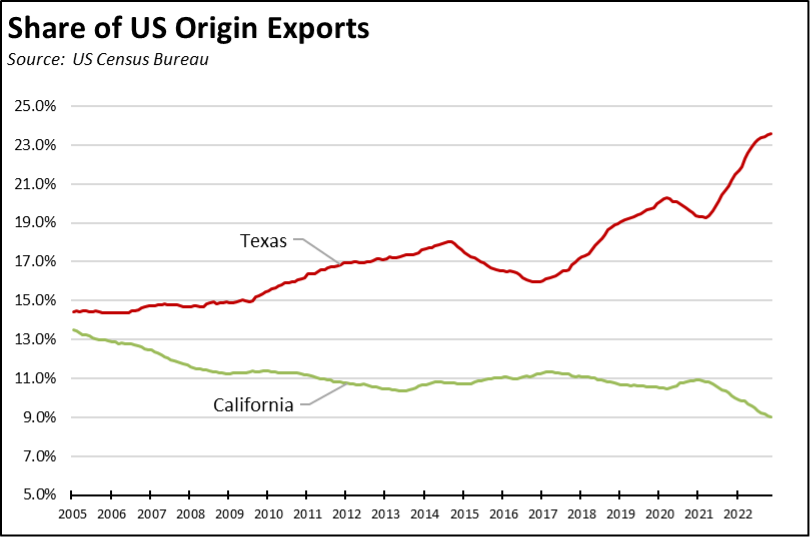
More critically for the state’s professed income and wage equity goals, the gap in export activity has grown substantially wider as manufacturing—including reshoring and foreign direct investment—shifts to the Southeastern states.
The state’s trade position led in the past primarily by its status as the first-port-of-landing for imports from China also faces continued weakening as companies shift their sourcing strategies to reduce the supply chain risks that became apparent during the pandemic. The current move to diversify supply chain production to other countries also means likely shifts in trade routes. While California ports remain poised to compete in this shift, growing costs from regulation and the supply chain chokepoints that became critical during the pandemic put the growing ports elsewhere in the country in a better competitive stance.
California Goods Exports
Total California goods exports were down $0.1 billion from November 2021 (down 1.0%). California remained in 2nd place with 9.0% of all US goods exports (12 month moving total), behind Texas at 23.6%.
California Goods Imports
Total California destination goods imports dropped $4.4 billion from November 2021 (down 10.6%).
Top 20 Exports, October 2022
Top 20 exports by value are shown below, along with the change from November 2021.