The latest new vehicle data from California New Car Dealers Association shows total new light vehicle registrations in 2020 were down 22% for the year as a result of the economic shutdowns, but total sales exceeded those during the Great Recession in each of the years between 2008 and 2012. This sales performance reflects the different effects coming from the state’s shutdown actions, with many higher wage jobs unaffected due to telecommuting. As a consequence, local government sales tax revenues from these sales were less affected than previously feared.

Key points from the 4th quarter results:
- Californians continue their shift to light trucks at 64% of new registrations in 2020; rest of US at 77%.
- BEV sales rose 2.6% over the same quarter in 2019 as higher wage workers maintained incomes through teleworking; total PEV sales were down 17% in the quarter, somewhat steeper than the 13% drop for all light vehicles due to another slump in PHEV sales.
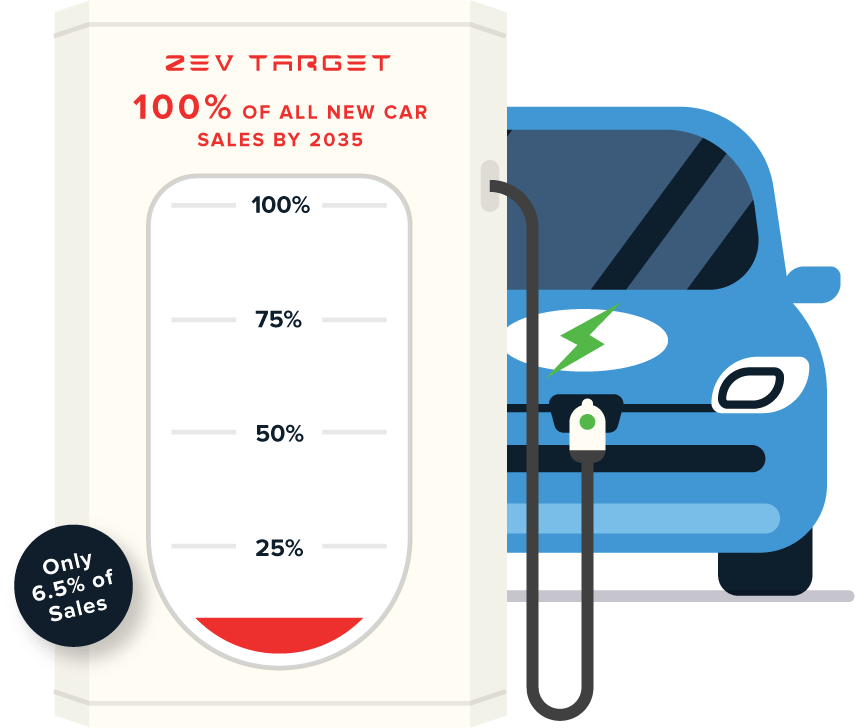
- ZEV market share eased to 6.5% and remains on course to reach only half of the state’s goal by 2035.
- New NBER working paper shows electric vehicles are used less than half as much as traditional fuel vehicles, raising questions over emission reduction estimates in the state’s regulations and feasibility of 100% ZEV sales to replace all existing vehicle uses.
- New Energy Commission data tracking vehicle sales shows ZEVs continue to be stronger in higher income areas, with higher income areas being 22 times more likely to buy a ZEV.
- The Energy Commission data also indicates BEVs have a high turnover rate in the state; PEVs were only 2% of total vehicle stock in 2019.
- Current state policies shift the cost of achieving its 100% by 2035 ZEV goal to low and middle income households and away from the higher income buyers of these vehicles.
Light Trucks Continue to Dominate Sales
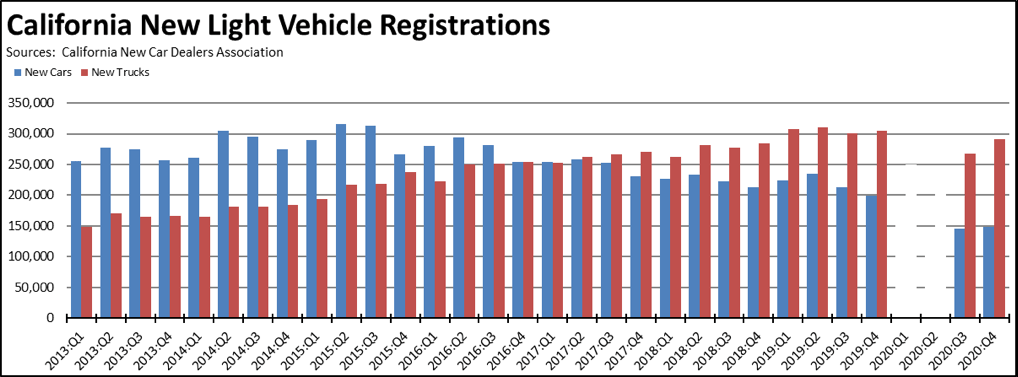
- Even at the reduced sales levels, Californians continued their shift to light trucks. This segment captured 66% of total new registrations in the 4th quarter, and averaged 64% for the full year. For all states other than California, light trucks were 77% of the market in 2020.
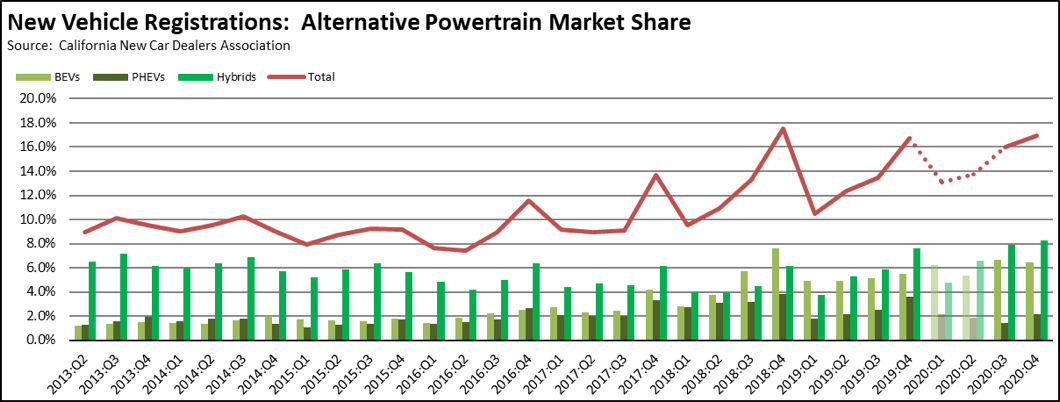
PEV Sales Down 17.1%
Source: Derived from California New Car Dealers Association
- In another indication of the disparate income effects of the state’s cycles of reopenings and shutdowns, sales of the higher cost battery vehicles held up slightly better as higher wage workers have been more likely to retain their jobs and incomes through telecommuting. Battery electric vehicles (BEVs) actually increased compared to the same quarter in 2019, while total plug-in electric vehicle (PEV) sales were down more sharply due to yet another plunge in plug-in hybrid vehicles (PHEVs). The other combustion engine component of the mix—gasoline hybrid vehicles (HEVs)—dropped less severely at a 5.5% loss. BEV sales in part likely showed more resilience in the current recessionary conditions due to the virtual abandonment of mass transit as a transportation option, including the higher income commuters previously using rail who sought alternative transportation modes.
- The increase in BEV registrations combined with the overall drop in sales saw this component reach a 6.5% market share in the 4th quarter, with an overall share of 6.2% for the year compared to 5.1% in 2019. Total PEVs were 8.6% for the 4th quarter and 8.1% for 2020, up only slightly from 7.6% in 2019.
- Standard hybrids (HEVs) again were important to the overall market share for battery vehicles. Reflecting their now consistent trend of recovery, HEVs comprised 49% of the new battery registrations, up from 46% in the same period in 2019.
- The combustion vehicle component of this market segment—PHEVs and HEVs—overall comprised 62% of the new battery vehicle registrations, again indicating a continuing hesitance on the part of consumers to shift to fully electric vehicles, either because of concerns over refueling and range or due to the remaining high bump in cost.
- Tesla remained the dominant producer of BEVs and consequently the primary beneficiary of the panoply of incentives and subsidies enacted by the regulatory agencies. Tesla sales rose to 75% of all BEV registrations in the 4ᵗʰ quarter.
- Overall market share has been rising but remains below the 2018 peak achieved through deliveries on Tesla’s backorders for the Model 3. The overall level, however, continues to be driven heavily by the combustion-vehicle component, in particular the continuing strength of gasoline hybrids and the far more variable levels for PHEVs.
State Goal: 100% ZEVs by 2035
The state previously maintained a goal of 5 million zero-emission vehicles (ZEVs) on California roads by 2030 pursuant to Executive Order B-48-18. Under Executive Order N-79-20, the governor recently changed this goal to require all new vehicles offered for sale in the state to be ZEVs by 2035 for light duty cars and trucks, and by 2045 for heavy and medium duty vehicles. In spite of the substantial but as-yet unknown costs and other effects of this action, the state agencies are now moving ahead to implement this order using the blanket authorities given to them by the legislature under the climate change program.
California’s sales mandates for ZEVs first began with the Air Board’s adoption of the LEV I regulations in 1990. After three decades, these mandates have resulted in ZEVs comprising 6.5% of new light vehicle registrations as measured against the diminished sales base in the fourth quarter. Even accepting that figure as the starting point, the current trendline estimated from a regression of the data to date indicates these vehicles are currently on track to be less than half of sales by 2035. Substantial deviation from trend would have to begin prior to 2025 in order to meet the 2035 goal. In other words, evaluation of the Order’s feasibility does not have to wait until 2035. The likelihood of achieving the 100% by 2035 goal and the likely costs of getting there can be measured substantially by what the state does in the next 4 years.
State Goal: Study Shows ZEVs Still Not a Full Replacement for Traditional Fuel Vehicles
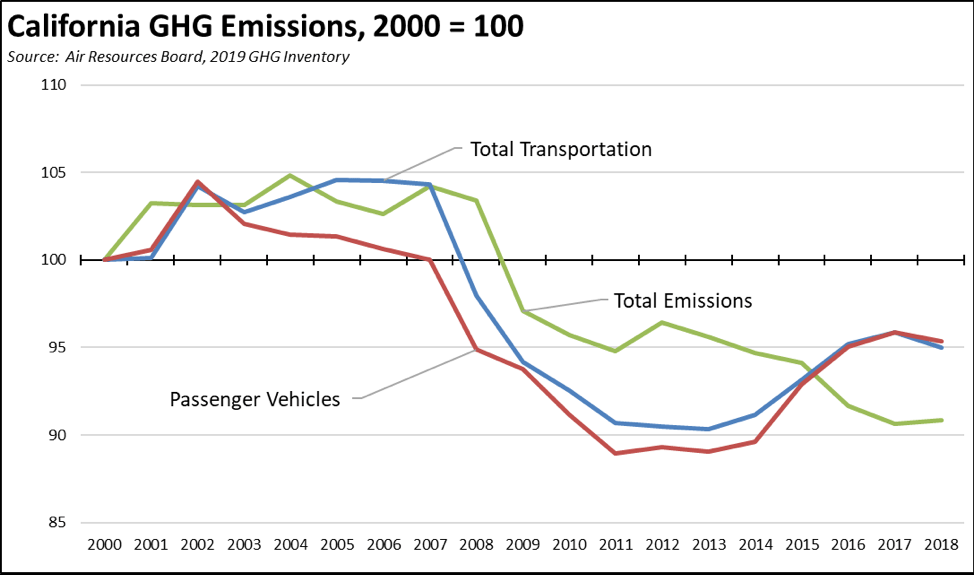
The state’s 100% by 2035 goal is largely driven by outcomes to date within the state’s climate change program. California along with the rest of nation experienced a sharp drop in greenhouse gas emissions (GHG) during the Great Recession downturn in 2008 and 2009. Emission reductions continued but at a slower pace following the implementation beginnings of the program in 2010. Progress then slowed in recent years and in fact reversed in the latest inventory for 2018. This overall trend stems in part from the amount of hydroelectricity generated each year as a result of legacy investments, but also follows from growing transportation emissions as total vehicle miles driven have grown and outdistanced what is otherwise an increasingly lower emitting vehicle fleet. Passenger vehicle emissions were 27% of the state total in 2000, dipped to 25% in 2010, but rebounded to 28% in 2018.
The inventory results for 2020 and 2021 are again likely to show a significant drop in GHG due to the current economic downturn and rapid shift to telecommuting. How much is then permanent as a result of restructuring within the economy similar to the Great Recession aftermath remains to be seen. Additional reductions are likely as a result of slowing if not negative population growth as workers and jobs move to other states with lower costs of living, but the extent of this factor is not yet clear. Transportation emissions, however, are likely to show a sustained drop coming from the rapid adoption of telecommuting as a permanent, post-pandemic work arrangement.
From a scoping level estimate, sustained telecommuting could achieve up to 11% of the emission reductions required to meet the state’s 2030 climate change goal, and more if state policies were adjusted to accelerate this trend. The emission reductions could also be accomplished in a more equitable way by expanding to lower wage workers in the private sector the flexibility under the state’s labor laws that now is applied to government workers.
As a voluntary change increasingly chosen by both employers and their workers, telecommuting could also attain these emission reductions with actual cost savings to both—a key factor highlighted in the current January budget proposal to expand this option for state workers. The state’s regulation-heavy approach under the climate change program to date instead has produced rapidly growing costs of living and operating a business within the state.
Attaining the 100% by 2035 goal and the cost of doing so through the current regulatory approach relies on a wide range of factors that have yet to be overcome, including but by no means limited to: continued improvements to battery capacity and recharging times, overcoming potential limitations in the supply of battery-critical materials through new mining operations or new battery technologies, the effects of shifting from energy dependence to a reliance on China for battery components, and development from the ground up of a sufficient fueling network. While the state’s ZEV policies are officially fuel neutral, the effective outcome of the state’s regulations, planning, and subsidy structures have placed the policy bets on full electrification. As discussed above, the current sales trends are dependent on actions in the next 4 years and leave little room for other options in order to meet this administratively established goal.
The ability to achieve the 100% by 2035 goal and the emission reductions envisioned by that goal also rely heavily on consumer acceptance and consumer behavior, in particular the assumption that electric vehicles substitute fully for the miles now driven in combustion vehicles. Earlier surveys indicated that the continuing presence of “range anxiety” led many households to use BEVs as a secondary vehicle, relying on their traditional fuel vehicles for commuting and many other daily activities. A more recent survey indicated that even households using a BEV as their primary vehicle often buy a larger, less fuel efficient combustion vehicle for longer travel and for trips requiring vehicles of this size—a “Fido can be in the SUV but not the Tesla” effect.
The pursuit of the 2035 goal, however, assumes that electric vehicles will replace all current vehicle emissions on a like-for-like basis. This is the nature of the regulatory process—adopted from that used for Clean Air Act purposes—used for the state’s climate change program. Emission reductions associated with a proposed regulation are estimated from a model. The inputs to that model come from surveys, technical data, and in some instances data coming from limited “case study” analyses. The measures themselves are rarely evaluated in real world operation, and emissions are instead tracked through broader measures, in this case the annual state GHG inventories which in turn rely in many cases on estimations and modeling as well. If the broader measures are not going in the right direction, more regulations are then assumed to be needed. In this case, the regulations adopted by the agencies to reduce vehicle miles traveled have produced few and in most cases no emission reductions if not in fact emission increases. Regulations under the 2035 goal therefore are being pursued to eliminate the emissions rather than the miles traveled.
As embodied in the regulations, the 100% by 2035 goal assumes electric vehicles are a full substitute for existing traditional fuel vehicles. A more complete accounting done in a recent NBER working paper instead concludes that currently, electric vehicles on average are driven an average of only 5,300 miles a year in California, or less than half the 11,600 average miles traveled per vehicle in 2018. Instead of data from a sample as in prior studies on this issue, the study was done from a large-scale analysis of electricity meter measurements in households with dedicated EV meters in the PG&E territory. This study indicates that electric vehicles are not yet a full-scale substitute for existing, traditional fuel vehicles. The current emission reductions attributed to these vehicles also have to considered from this lower use level and the study’s other finding that about 75% of charging occurs at home, or lower than the 85-90% assumed by the Air Resources Board in its previous rulemakings.
This study is the first to make a more detailed assessment of what is happening as a result of the state’s regulations. The analysis, however, only measures the results using real world data, and does not assess in detail why this lower use occurs or analyze whether these use levels will change in the future. The dramatically different results from this data at a minimum suggest the potential limitations and consequently the potential economic damage coming from regulations that assume technology will become available and that it will be used as the regulations say it will be used. Regulatory agencies have the authority to issue regulations attempting to change consumer and human behavior. The humans in question don’t always necessarily agree.
State Goal: New Energy Commission Still Shows BEVs as a Higher Income Good
In order to improve tracking of progress towards the 100% by 2035 goal, the Energy Commission recently has begun to publish data jointly with the Department of Motor Vehicles that previously was available primarily through Public Records Act requests. The data provides information on both vehicle sales and light vehicle populations by county and by zip code.
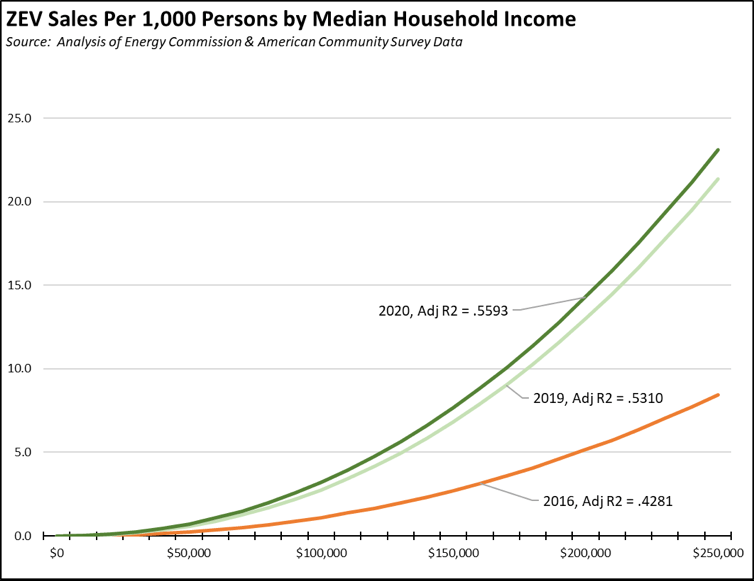
Using the vehicle sales by zip code data, new BEV registrations continue to be strongly concentrated within the higher income areas of the state. The analysis below uses both median household income and population from the Zip Code Tabulation Area data from the 2016-2019 American Community Survey (ACS). The ZCTAs are not necessarily fully conterminous with the zip code areas, but instead are a standardized geographic area that allows comparisons over time. Only zip codes showing PEV sales in each year are included. The analysis below also includes only zip codes with population, and does not include registrations in those covering business or public facilities. This last factor only affects 160 – 263 BEVs, depending on the year.
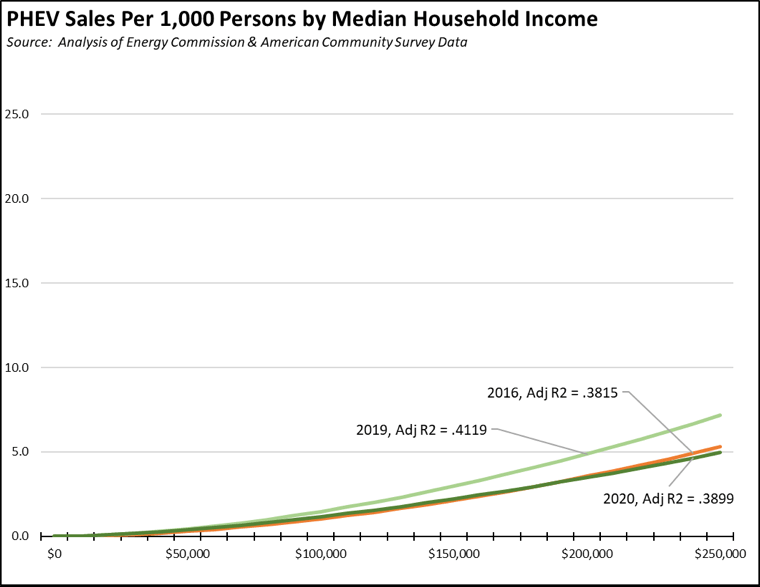
Combining the ACS data with the Energy Commission data, within those areas buying a PEV, higher income areas were far more likely than the lower ones to do so, with higher income areas over 22 times as likely to buy a BEV in 2020. The numbers for BEV purchases in particular for the higher income areas took a jump in 2018 as a result of backorder deliveries of the Model 3 at the end of the year. The numbers for PHEVs are far more variable, but still show an income trend in each year. Part of this pattern is the tendency of higher income households to buy new cars overall, but the differences in the three highest income areas illustrate the effect of the continuing high premium for these cars.
Sales Per 1,000 by Median Household Income
Source: California Energy Commission, New ZEV Sales, last updated 1/29/2021; US Census Bureau, American Community Survey
These relationships can be illustrated further using regression analysis to produce the estimated trend lines in the charts below. All equations take the form of:
Sales per 1,000 persons = a X (Median HH Income)ᵇ
As indicated by the adjusted R2 numbers, income differences provide a better “fit” for the estimated trend lines for the BEV data. In both cases, income is capable of accounting for only a portion of the variance, and other factors are obviously in play. The BEV data suggests a much stronger effect coming from higher incomes and one that has continued to grow even with the expansion of available models and lower price models in this period. The PHEV data instead shows a less pronounced income relationship and one that is as likely influenced by the tendency of higher income households to buy new vehicles in the first place.
State Goal: BEVs Show a Higher Attrition Rate
State progress tracking for the previous 5 million ZEV goal concentrated on sales rather than actual “vehicles on the road” as specified in Executive Order B-48-18. Our previous reports included adjustments to account for turnover in the fleet as the result of households moving out of state, accidents, replacements, and other factors causing previously sold ZEVs to longer be on California’s roads. The new Energy Commission data now provides this information directly.
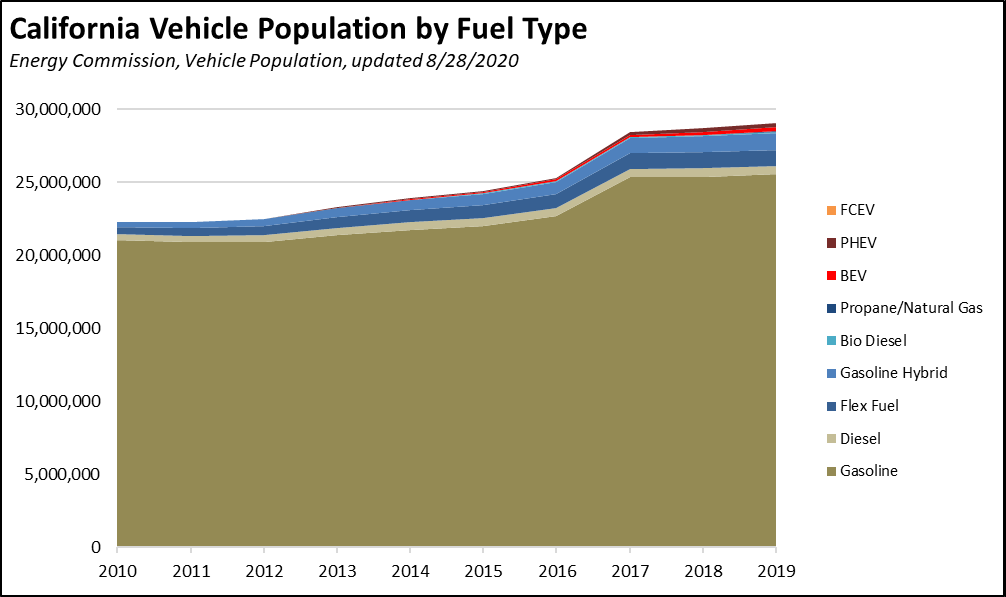
The following table compares battery vehicle sales by type between 2010 and 2019 from the California New Car Dealers data with the Vehicle Population numbers from the Energy Commission (updated 8/28/2020) for 2019. As indicated, BEVs show a substantially higher attrition rate, likely for a number of factors including the replacement of earlier models with longer-range current ones and the beginnings of higher income tech workers migrating to emerging tech centers in other states and taking their BEVs with them. HEVs instead show an increase of the stock over the prior 10-years of sales. Likely reasons include sales of these models in years prior to 2010 and migration into California from states where HEV models have been more available than BEVs and PHEVs.
Battery Vehicle Attrition, 2010 – 2019
Sources: Energy Commission, Vehicle Population, updated 8/28/2020; California New Car Dealers Association
Overall, PEVs—BEVs, PHEVs, and hydrogen vehicles (FCEV)—were only 2% of the 29 million light vehicles in the total California vehicle stock in 2019. Other alternatives to pure gasoline light vehicles—diesel, bio diesel, flex fuel, HEVs, and propane/natural gas—represented over 5 times as many vehicles on the road in large part because they can be fueled easily from extensive, existing systems. The success of the state goals instead relies not only on building new fueling systems from scratch, but building new generation to supply them as well.
State Goal: But Funding for the Goal Imposes Greater Costs on Lower & Middle Income Households
While higher income households remain the higher propensity buyers of BEVs, the current financing sources promoting the 100% by 2035 goal are structured to fall more heavily on middle and lower incomes. Earlier policies to promote and subsidize the purchase of the electric vehicles bought predominately by higher income households was through the use of tax credits, rebates, and subsidized electricity rates that often required a public vote for the allocation of these funds. The current financing structures have turned instead to measures that embed the costs of subsidies for the 2% of vehicles on California’s roads into fees and rates otherwise paid by 100% of households, in particular targeting essential costs of living that evidence a far less progressive structure than the current BEV consumption profile. By making the costs less transparent, this approach also makes it more difficult to assess the full cost of the state’s intended transition.
Fuel Taxes. In 2019, the average income homeowner household paid an estimated $750 in gasoline taxes, and the average income renter household paid $670. Other than the new transportation improvement fee that applies to all vehicles, the higher income buyers of BEVs instead only pay a $100 annual road improvement fee for road maintenance and repairs that became operational only in July 2020 and that does not apply to BEV models prior to 2020. As BEVs become a larger share of the vehicle population, the burden of paying for roads used by ZEVs falls more heavily on the lower and middle income owners of traditional fuel vehicles.
Fuel Costs. As a result of costs imposed directly through state regulations, Californians now pay the highest or second highest fuel prices in the nation. California prices for regular gasoline have averaged $1.08 a gallon higher since February compared to the average for the other states, and $1.36 higher when compared to the lowest cost state. These same regulations also isolate California from the broader US and world markets, often leading to price spikes from any disruptions to the in-state supplies. As refinery capacity is reduced even further in accordance with Executive Order N-79-20, supplies will become even tighter and even more vulnerable to these price swings, impacting in particular the lower and middle income consumers at the end of the transition chain into electric vehicles.
Vehicle Fees. The current budget proposes extension of several vehicle registration fees in order to finance ZEV recharging infrastructure. While these fees are charged on both ZEV and non-ZEV vehicles, the costs are being paid by all to make it easier to fuel the 2% of PEVs within the current vehicle stock. Budget documents indicate these fees currently average $108 million a year.
Cap and Trade. The Cap and Trade auction revenues have often been used to promote ZEVs, including the current budget proposals for $465 million in subsidies for both light duty and heavy duty ZEVs. The Cap and Trade system embeds these costs into the prices charged in a substantial portion of the California economy, including electrical utilities and for both the production and use of traditional fuels on which many lower and middle income households will continue to rely for many years even if the state reaches the 100% ZEV sales goal in 2035. Although the auction results were more variable in 2020, the Budget Fund Condition Statements show revenues (consumer costs) averaging $2.2 billion annually in recent years.
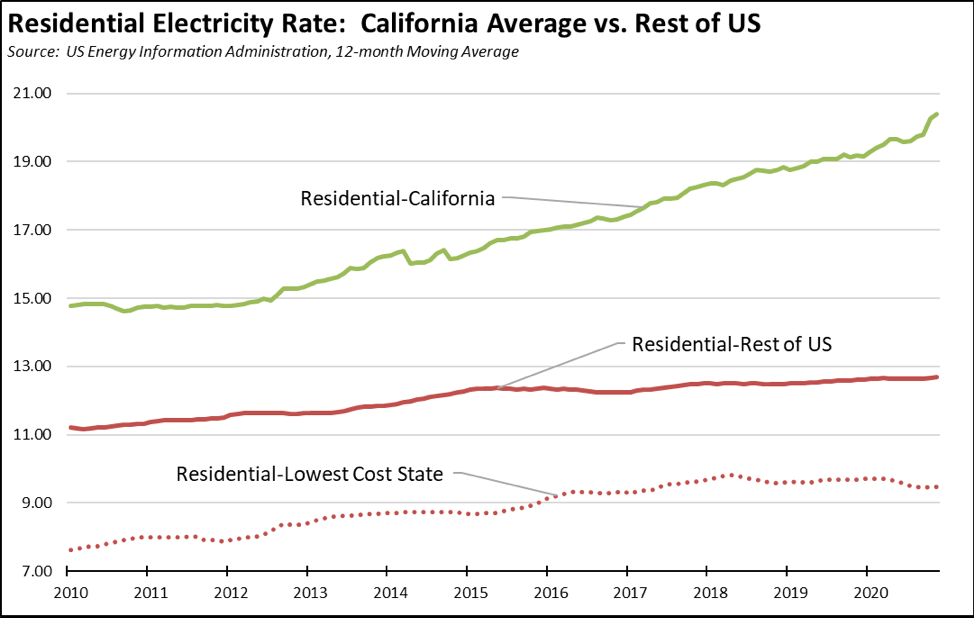
Electricity Costs. In November 2020, the average residential electricity rate in California was 20.40 cents per kWh (12 month moving average), or 38% higher than the rate in 2010, the year the state’s climate change regulations began through the AB 32 early action items. At the height of the electricity crisis at the beginning of the 2000s, California’s residential rate peaked at 54% above the average for the rest of the US. In November 2020, it was 61% higher. As detailed in the Center’s monthly energy reports, commercial and industrial rates show comparable escalating costs.
California’s higher rates translate directly into the state’s rising housing costs. In 2019, soaring utility costs (gas and electricity) ranged from an estimated 3.7% of total housing costs for the average income homeowning household in San Francisco to 12.7% in Stanislaus County and up to just over 17% in Imperial County, and for the average income renter household, from 3.5% for San Francisco to 16.9% in Fresno County and up to just over 26% in Imperial.
The operation of the state’s regulations to date have taken electricity rates to among the highest in the nation. Although the NBER working paper discussed above calls into question the assumptions behind current load forecasting, the Energy Commission’s work to date indicates most generation additions required in the future will be to meet the demand of electric vehicles. Combined with the state’s 100% renewables goal, the combination of new generation of this type, new transmission, and the requirements for storage or other backup to even out renewables will likely see the state’s high rates continue to rise. The lower and middle income households still relying on traditional fuel vehicles will consequently pay twice—once as the price of those traditional fuels continue to rise and again as their electricity rates keep rising to pay for the generation required to power the new, higher cost vehicles being driven by others.
Electricity Rates. Also embedded with the state’s higher rates have been various programs to subsidize electric vehicles and recharging infrastructure directly, including the most recent action by the Public Utilities Commission to authorize additional rebates of $1,500 by the state’s investor owned utilities. As electricity costs continue their ceaseless rise, a portion paid by households in general is going to support the buyers of 2% of the state’s vehicle stock.
Regulations. As direct subsidies to higher income buyers of electric vehicle have become more difficult to justify, the state has shifted more to the use of regulations to embed these costs into the price of vehicles instead. These subsidies come in two forms. First, all vehicle producers must comply with the federal Corporate Average Fuel Economy (CAFE) standards for all vehicles sold in California and the rest of the US. In the process, the less efficient light truck models that customers prefer and that generate most of the producer profits generally must be offset by the production of much more efficient vehicles—ZEVs—or through the purchase of emission credits from the companies that do make them. In fact, the CAFE standards approved at the last minute by the Obama Administration were set primarily to promote ZEVs. Second, California and the states adopting its standards have separate requirements for ZEVs as a percentage of vehicles offered for sale. Producers again can comply by making those ZEVs (although, not necessarily selling them) or by buying credits from other companies that do. In the most recent results for Model Year 2019, Tesla, Honda, and Subaru attained compliance with the federal emission standard from the vehicles they produced. The other 11 largest vehicle manufacturers instead complied using banked or purchased credits.
In the process, the compliance cost for both sets of regulations are shifted to the average vehicle buyer while ZEV producers are then able to offer their products at a lower, indirectly subsidized price. The total costs are unknown but can be illustrated by size of regulatory credit sales by Tesla, which to its credit, is one of the few if not only vehicle producers making this information public in its annual 10-K filings. Between 2016 and 2020, Tesla earned $3.3 billion from the sale of regulatory credits, of which $1.6 billion was earned in 2020 alone. Based on US sales, this indirect subsidy has varied in this period from about $2,200 to $7,200 per vehicle. As both the CAFE and ZEV requirements become stricter, the cost effect of these credits—both developed internally or sold externally—on non-ZEV production will rise. This cost effect could diminish if the production cost differential between the two types of vehicles becomes equalized, especially for the larger vehicles consumers prefer to buy, but this point has not yet been achieved. In the meantime, consumers of non-ZEVs will continue to subsidize ZEV buyers through their purchases.
Used Vehicles. Lower income households will be less likely to affected directly by these regulations. In general, they are less likely to purchase new vehicles, either an unsubsidized non-ZEV or a ZEV being promoted through state rebates. The most immediate effect will instead come through the indirect pressures on the used market. As new vehicle prices rise through an increasing share of more costly ZEVs, used prices will rise as well.
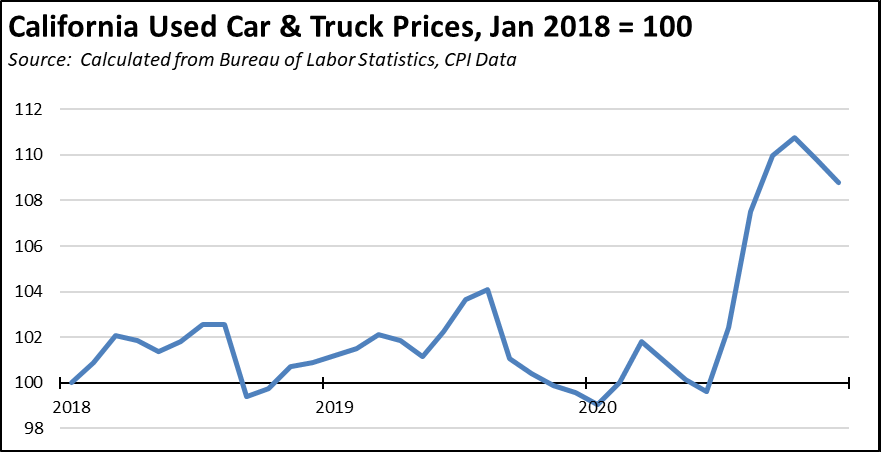
In the current circumstances, used vehicle prices are already rising rapidly above their historic trends. As mass transit ridership has essentially collapsed, workers instead have turned to other transportation modes in particular used vehicles. This trend has been further accelerated by the increase in delivery jobs as an alternate source of income and at least to some extent by this sales channel shift for restaurants, food, and other retail operations. In the chart below, the California CPI component for Used Cars & Trucks was calculated using the same formula used by Department of Finance to calculate the overall California CPI. Prices for used vehicles began spiking during the summer in 2020 and remain at significantly high levels. US prices overall followed a similar trend but one that is marginally higher.
The current economic downturn is notable due to a number of factors, but key among these is that the job and income losses have been concentrated to a high degree among lower wage workers compared to the more dispersed effects in prior recessions. In the latest December data, all of that month’s job losses were in the lower wage industries. Even as these workers now face likely years of struggle to regain job and income stability—and as their former employers face similar struggles to provide it—state policies continue to raise the costs of living paid by all households in order to promote use of specific technologies that continue to be consumed at far greater levels by those with higher incomes.