Highlights for policy makers:
- COVID-19 and the State Economy
- CaliFormer Businesses: Update
- Nonfarm Jobs: 60,700 Above Pre-Covid Peak
- Job Change by Industry
- Employment 273,500 Below Pre-Covid Level
- Labor Force Participation Rate
- Unemployment Rates by Legislative Districts
- Unemployment Rates by Region
- Employment Recovery by Region
- MSAs with the Worst Unemployment Rates
COVID-19 and the State Economy
As discussed in our preliminary report, the November data again indicates mixed results for the state’s recovery progress, but this time combined with a general slowing in the numbers. Nonfarm jobs remained above the pre-pandemic high, but at 26,800 was the second lowest monthly gain for the year and less than half the average monthly gain of 58,500 in the previous ten months of the year. The employment results were even weaker, with the loss of 42,700 representing the fourth month in a row with a contraction in the number of employed workers.
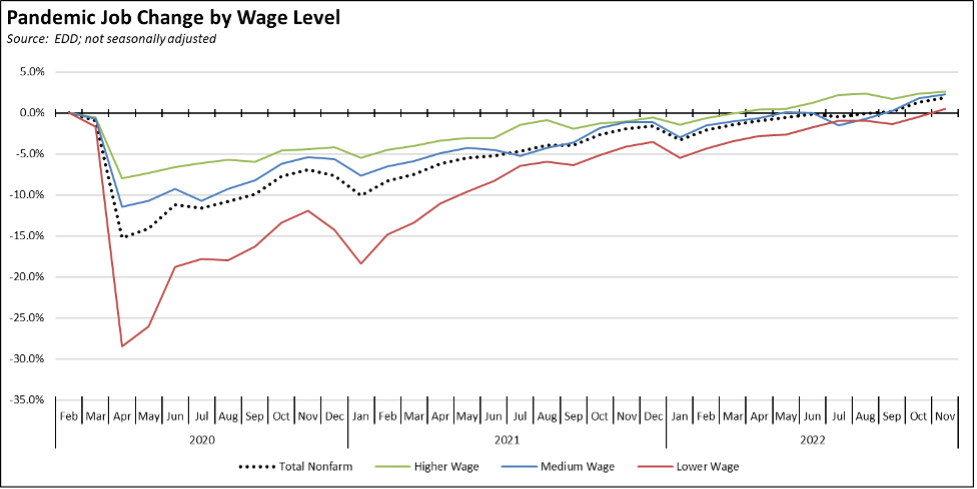
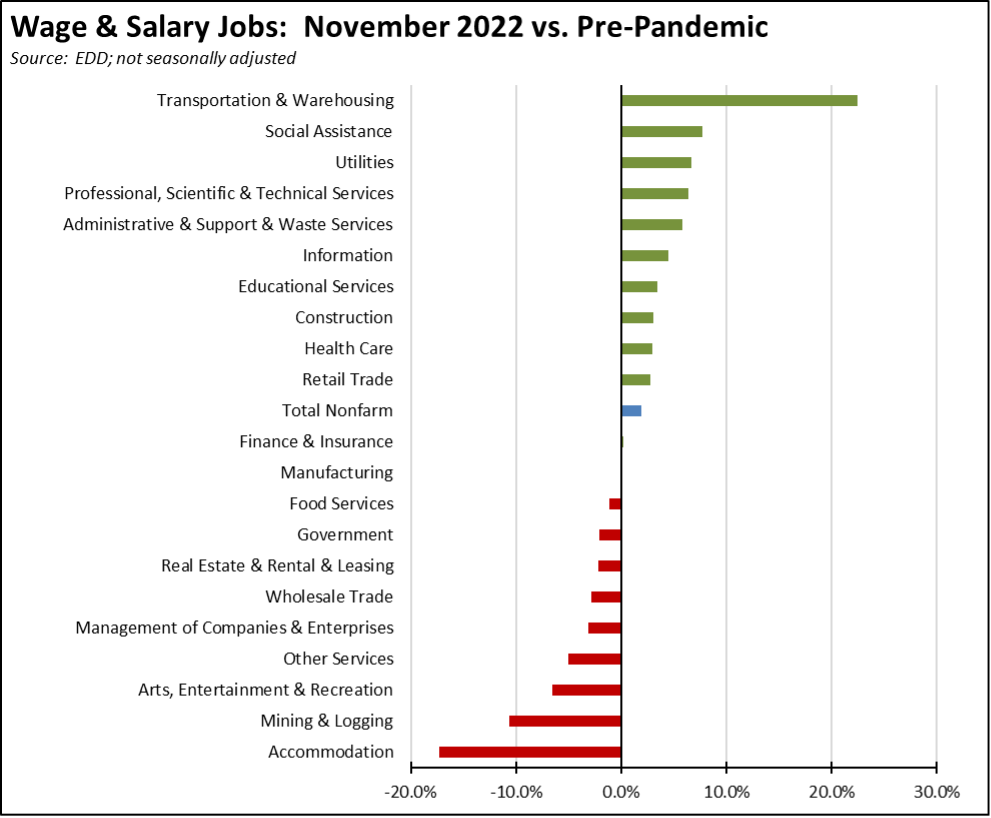
The jobs recovery in California also varies across industries and wage level. Using the unadjusted numbers to show results by average wage level, all three wage groupings passed the pre-pandemic highs in November. Growth, however, continues to lag in the lower wage industries.
The California economy retains the potential for stronger growth, but continues to face a number of prevailing forces limiting that expansion.
While gasoline prices have shown a significant decline over the past month, California’s higher regulations and taxes maintain the average state price well above the costs in other states. State regulations and taxes also continue to push other energy costs ever higher, with the latest results showing business-critical diesel the highest among all the states, commercial electricity rates the highest among the contiguous states, industrial natural gas the second highest, and industrial electricity rates and commercial natural gas the third highest. Low cost and supply stable energy has been a critical factor for economic development both in the developed economies and developing world. California continues to risk its economic future on a strategy that runs counter to that experience.
Throughout the pandemic, trade was the one positive economic story. Jobs within Transportation & Warehousing grew well beyond the pre-pandemic levels, and unlike recent experience in the rest of the state economy, comprised middle class wage jobs and in particular blue collar jobs necessary to make sustained progress against wage and income inequality as opposed to temporary measures such as the recent rise in transfer payments. Continued uncertainty over the potential for a West Coast port strike combined with congestion and growing costs, however, has seen the beginnings of a shift of cargo traffic to East Coast and Gulf Coast ports. And once trade patterns shift, they are likely to remain on this trend for the foreseeable future, undermining this blue collar growth center in the state.
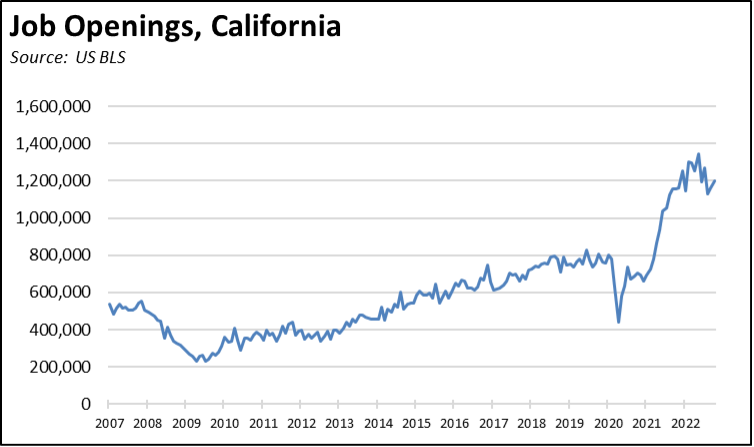
Broader labor shortages also continue to hold back potential jobs growth overall. The November data shows California’s labor force declining for the third month in a row, now at a point nearly 300,000 below the pre-pandemic peak. Demand for labor, however, remains elevated, with unfilled job openings still running near series highs even as companies especially in the tech industry have started to cut back on hiring plans.
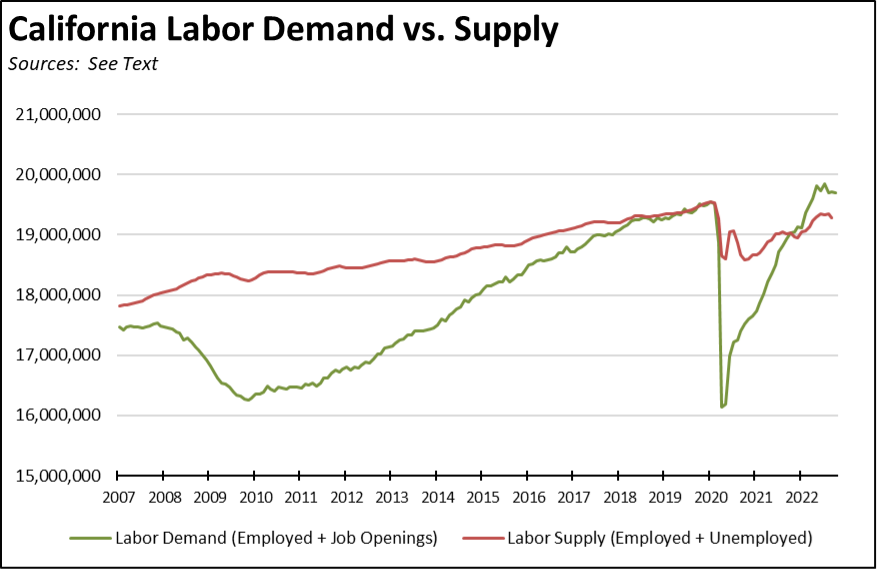
Combining unfilled job openings with the labor force data, total labor demand has exceeded the available supply since last October.
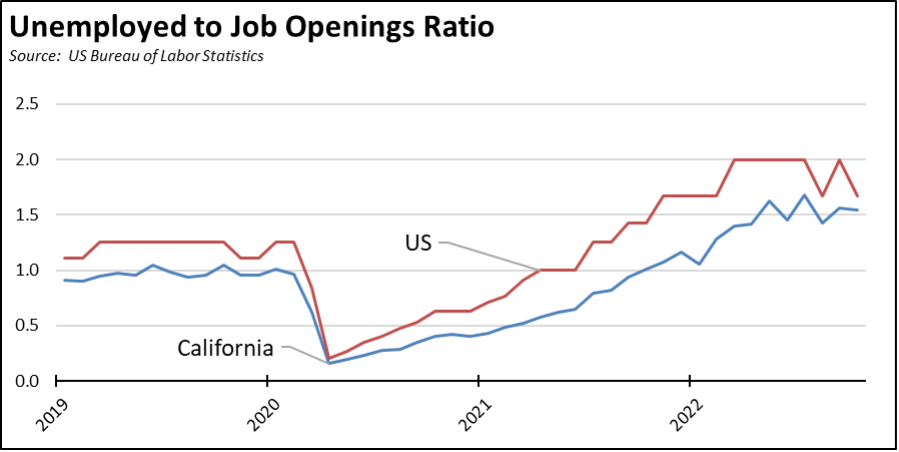
In the latest data for October, there were 1.5 unfilled job openings for every officially unemployed person in the state.
In addition to overall demand, skills mismatches also play a role holding the state back from reaching its current jobs potential. While only the total job openings data is available at the state level, the detailed national data indicates that the largest shortages are in industries representing a mix of both higher and lower wages: Health Care & Social Assistance, Professional & Business Services, and Accommodation & Food Services. In the table below, the Job Openings Rate indicates job openings as a share of total jobs within each industry in October.
CaliFormer Businesses: Update
Additional CaliFormer companies identified since our last monthly report are shown below. The listed companies include those that have announced: (1) moving their headquarters or full operations out of state, (2) moving business units out of state (generally back office operations where the employees do not have to be in a more costly California location to do their jobs), (3) California companies that expanded out of state rather than locate those facilities here, and (4) companies turning to permanent telework options, leaving it to their employees to decide where to work and live. The list is not exhaustive but is drawn from a monthly search of sources in key cities.
| wdt_ID | Companies | From | To | Reason | Link | Date |
|---|---|---|---|---|---|---|
| 1 | Nixplay | Sunnyvale | Denver | HQ move | Read More | 2022 |
| 2 | EnerVenue Inc. | Fremont | Kentucky | $264 million battery plant | Read More | 2022 |
| 3 | Fujifilm Irvine Scientific | Santa Ana | North Carolina | $188 million cell culture manufacturing facility | Read More | 2022 |
| Companies | From | To | Reason | Link | Date |
In addition to businesses, individuals and households continue to move out of the state. One measure of this activity is from the Census Bureau’s new Job-to-Job flow data tracking the number of workers moving from one job to another. In the latest data covering the first three quarters of 2022, a total of 187,700 workers moved from a job in another state to one in California while 250,200 left California, or a net loss over the period of 62,600. This data only measures workers moving from one job to another, and does not include students and unemployed moving for work purposes.
On a regional level, the Bay Area (San Francisco-Oakland and San Jose-Sunnyvale-Santa Clara MSAs) saw a net loss of 4,200 workers in this period, while Los Angeles-Long Beach-Santa Ana had a net loss of 32,000. Within the Information and Professional, Scientific & Technical Services industries containing most of the state’s tech industry, there was a net loss of 11,900 workers moving to other states.
Nonfarm Jobs: 60,700 Above Pre-Covid Peak
Nonfarm wage and salary jobs were up 26,800 (seasonally adjusted) in November, while the estimated gains in October were revised up to 59,800.
The November results put California nonfarm jobs 60,700 above the pre-pandemic peak, joining 25 other states with positive jobs growth since February 2020. California’s total lags 8 other states showing positive growth, ranging from Colorado at 82,300 to Florida at 487,400 and Texas at 706,700. As discussed in our preliminary report, the job numbers for 2022 are likely to be adjusted downwards for California and other states in the upcoming revisions to be released in the first quarter of 2023.
Job Change by Industry
Using the unadjusted numbers that allow a more detailed look at industry shifts, the number of industries showed job levels at or exceeding the pre-pandemic February 2020 levels edged down to 11. Transportation & Warehousing again showed the strongest cumulative jobs growth (149,400) by a large margin, with higher-wage Professional, Scientific & Technical Services remaining in second place at a gain of 86,800. Accommodations remained the most behind, while Mining & Logging continued to reflect state policies to eliminate the higher wage jobs in this industry.
Employment 273,500 Below Pre-Covid Level
Employment (seasonally adjusted; November preliminary) continued to lose ground for the fourth month in a row, down 42,700 from the revised numbers for October. The number of unemployed rose 21,800.
The reported unemployment rate rose 0.1 point to 4.1%. California had the 12th highest unemployment rate among the states, and contained 13.2% of the total number of unemployed workers in the US.
In the national numbers, total US employment was down 138,000, and the number of unemployed dropped by 48,000. With the labor force little changed, the reported unemployment rate was unchanged at 3.7%.
Figure Sources: California Employment Development Department; US Bureau of Labor Statistics
Labor Force Participation Rate
The California labor force participation rate dipped 0.1 point to 62.2%, while the US number also moved down 0.1 point to 62.1%. The California rate still remains below the pre-pandemic level of 62.8%, which in turn was down substantially from prior years. Accounting for workers leaving the workforce since February 2020, there were an estimated 1.0 million out of work in November.
Unemployment Rates by Legislative Districts
We will be pausing publication of these estimates until the necessary data is available for the new legislative district boundaries from the American Community Survey.
Unemployment Rates by Region
Unemployment rates (not seasonally adjusted) compared to pre-pandemic February 2020 are shown below.
Figure Source: California Employment Development Department
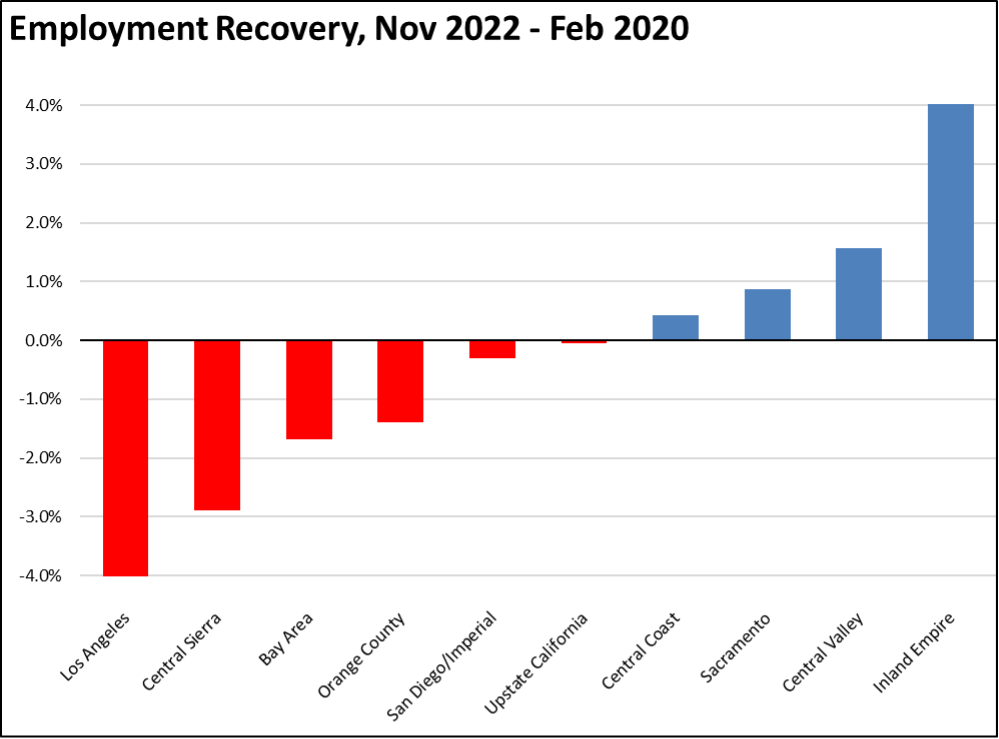
Employment Recovery by Region
Los Angeles Region continues to lag the rest of the state in recovery to the pre-pandemic peak employment levels. Upstate California shifted into the negative column primarily due to seasonal factors.
MSAs with the Worst Unemployment Rates
The number of California MSAs among the 25 regions with the worst unemployment rates in October rose from 8 to 10. Los Angeles-Long Beach-Anaheim MSA rose to #292 in a tie with 11 other MSAs in other states. The best performing California urban region was again San Jose-Sunnyvale-Santa Clara MSA, rising to a tie with 10 other MSAs at #23, with an unemployment rate of 2.2% compared to the best performing region, Mankato-North Mankato, MN MSA, at 1.3%.