The Center for Jobs and the Economy has released our full analysis of the May Employment Report from the California Employment Development Department. For additional information and data about the California economy visit www.centerforjobs.org/ca
Highlights for policy makers:
- California Unemployment Rate Highest Among the States for 4th Month in a Row
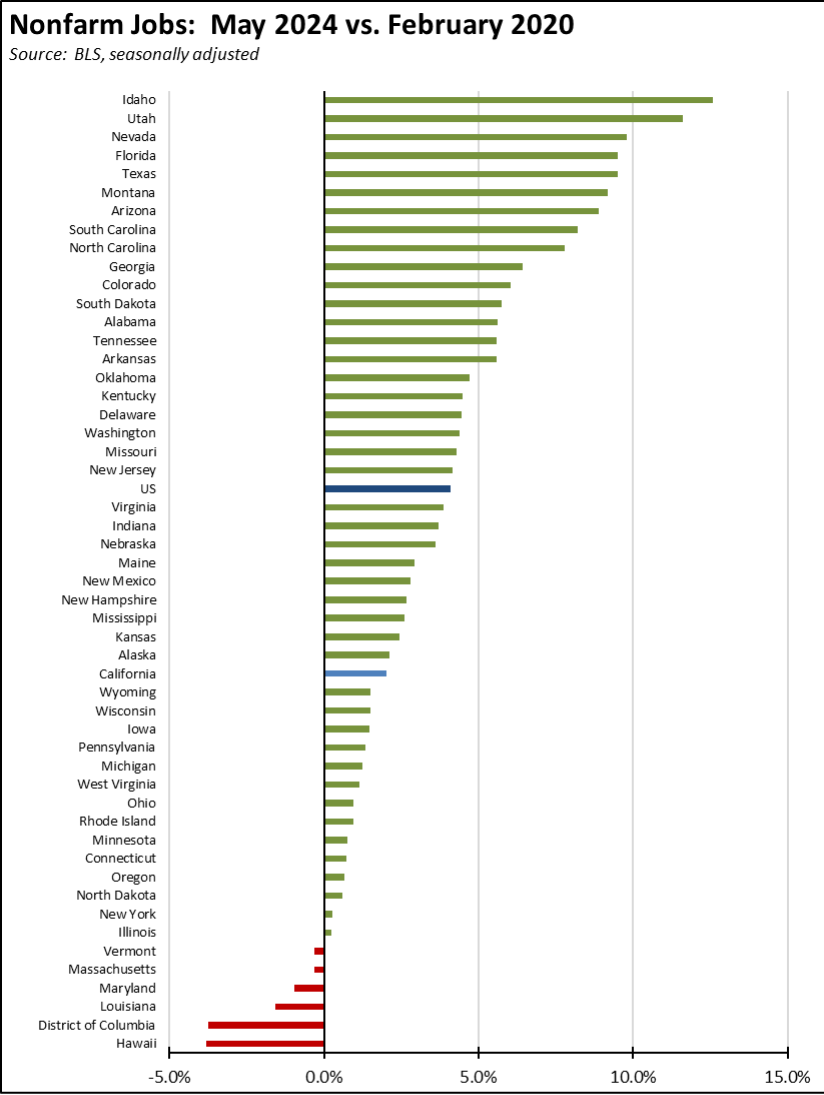
- Nonfarm Jobs Numbers Improve but California Still Ranks 4th in Overall Jobs Recovery
- Nonfarm Job Numbers Likely to be Revised Lower
- Job Performance by Industry
- JOLTS Data Signals Weakness in Future Jobs Growth
- Califormer Businesses
- CaliFormers List
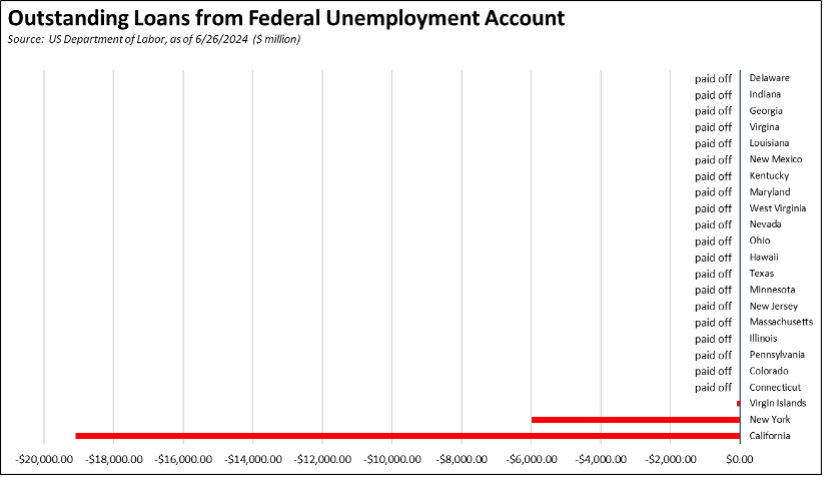
- State UI Fund Sinks Further through Multi-year Deficits
California Unemployment Rate Highest Among the States for 4th Month in a Row
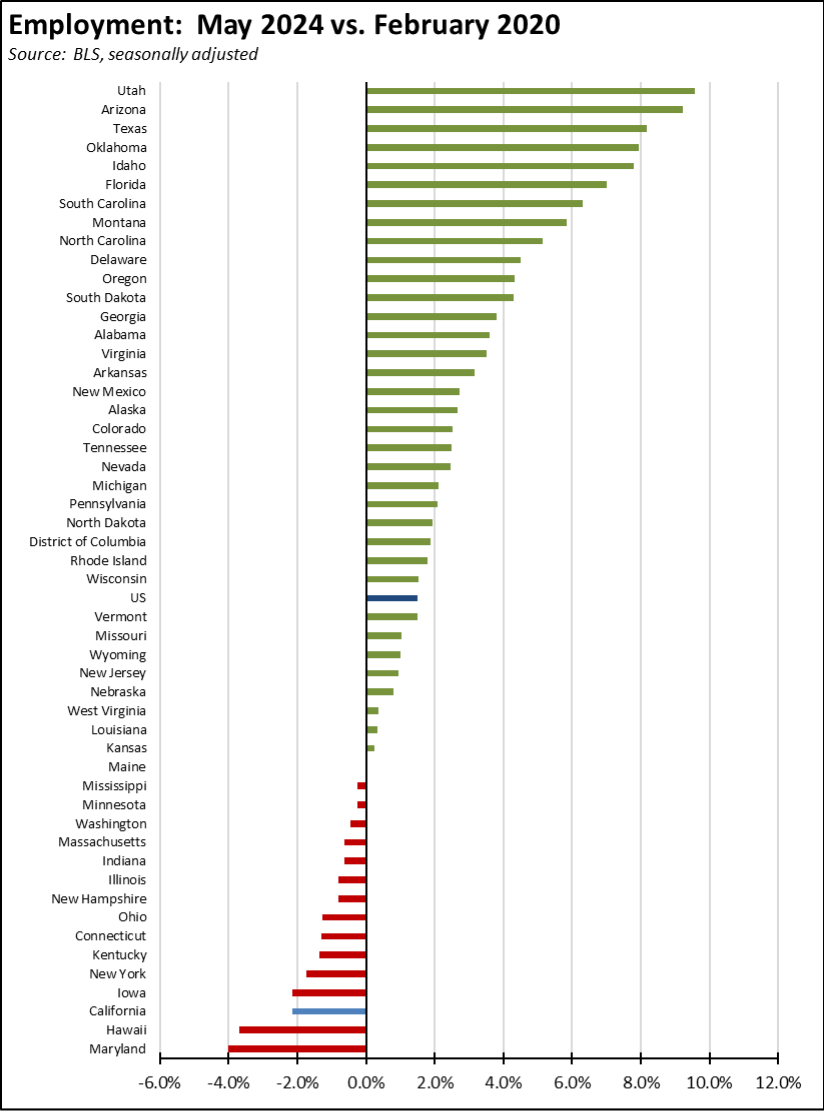
While nonfarm jobs were more positive in May, the labor force numbers continued to post weak results. Although dropping 0.1 point to 5.2%, California’s unemployment rate (seasonally adjusted) was again the highest among the states for the 4th month in a row. The DC rate was marginally higher at 5.3%, but among the states, California was the highest.
While all three showed marginal improvements in the seasonally adjusted numbers, unemployment remained above the 1 million mark for the 5th month in a row. Employment was 403,700 below recovery to the pre-pandemic level, and total labor force was short by 253,900. Adjusted for size, California’s employment recovery rate again ranked 49th among the states and DC.
A recent report from Beacon Economics assessed the current surge in unemployment in the state, and concluded that these numbers are being driven primarily by youth and young adult workers under the age of 25. The report indicates that that pattern in turn results from the recent substantial increases in the minimum wage, both generally and for specific industries at both the state and many local levels. While incremental raises in minimum wage generally show correspondingly incremental effects in their employment effects, the unprecedented increases in particular have had more noticeable effects on lower skilled workers at these ages.
The potential consequences are both immediate and long term. The immediate effects obviously are in reduced employment opportunities for these workers, with employers generally looking to fill the now higher wage jobs with workers having a broader and more developed skills set that can justify that higher wage. Longer term, the literature is extremely clear on the lifetime job and income benefits coming from developing workplace skills early. Eliminating these opportunities as is now happening for the younger labor force consequently will serve to increase income inequality over time, in particular for the income and demographic groups the minimum wage increases purport to benefit.
Nonfarm Jobs Numbers Improve but California Still Ranks 4th in Overall Jobs Recovery
At a gain of 43,700, nonfarm jobs showed the best improvement since last October. The April numbers were revised down 1,100 to a gain of 4,100. Overall, the May results raised the average monthly gains to date in 2024 to 17,000, well above the tepid results of only 6,400 during the same period in 2023 and closer to the overall average of 20,800 in pre-pandemic 2019.
Even with the bump from the May results, California still ranks 4th among the states in terms of net jobs created since the pre-pandemic peak.

Adjusted for size, California remained at the 31st highest.
Nonfarm Job Numbers Likely to be Revised Lower
The monthly job numbers are based on a monthly survey and estimated through a modeling process. They are then revised on a periodic basis primarily using the actual job counts coming from the Quarterly Census of Employment & Wages (QCEW). The US numbers are now adjusted quarterly. State and local numbers are instead revised annually at the beginning of each year. This year, California had by far the largest revision among the states, with the nonfarm job numbers in December 2023 adjusted to 231,800 lower than previously reported.
With the recent release of the 4th quarter QCEW data for 2023, California’s job numbers appear to be headed towards a similar scale downgrade for the current year as well. While the actual adjustments will not be known until next year, the likely changes are estimated on an ongoing basis by the Philadelphia Federal Reserve Bank. Using their 2023 Q4 estimates through April 2024 based on the recent QCEW release, California’s absolute job performance since the pandemic would sink to 10th highest among the states after revisions are made at the expected levels. This outcome would put overall job performance just above Virginia, a state whose economy is only one-fifth the size of California’s.

Job Performance by Industry
Nonfarm job growth continues to be dominated by state and federal spending, with Government and Healthcare & Social Assistance still accounting for all of the reported job growth between May 2023 and May 2024. In this period, these two industries grew by 194,700 jobs (not seasonally adjusted). Other total private jobs—tech and other private industries—were essentially unchanged with a loss of 9,700. The seasonally adjusted series shows a similar outcome, with Government and Healthcare & Social Assistance accounting for 199,900 of the 207,700 nonfarm jobs gain over the year.
Jobs growth within the state consequently has become less dependent on its innate economic dynamism as this advantage has been undermined by increasing costs of doing business, higher taxes, and increased regulations. Growth reliant on the two industries instead has become dependent more on the state and federal spending that support them—wholly in the case of government and substantially in the case of Healthcare & Social Services—and both funding sources are now at risk as the federal government faces unsustainable deficits and as the state’s previous unprecedented surpluses turn into shortfalls below what is needed to sustain its unprecedented spending levels. As the state budget shifts to increased taxes on employers to sustain that spending—including restrictions on the R&D credit that has helped make California an innovation leader—the resources required to build private jobs in the state will be undermined even further.
How this dynamic has evolved especially in recent years can be explored by looking at some of the state’s leading industries. To keep the data consistent, all industries use the not seasonally adjusted series unless otherwise noted.
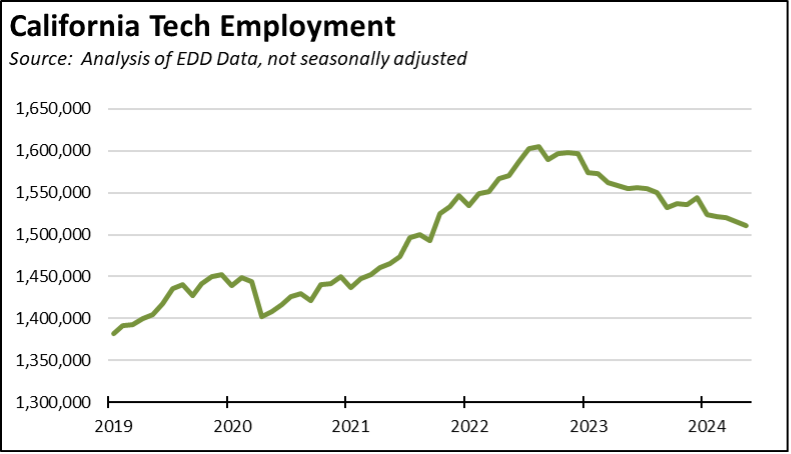
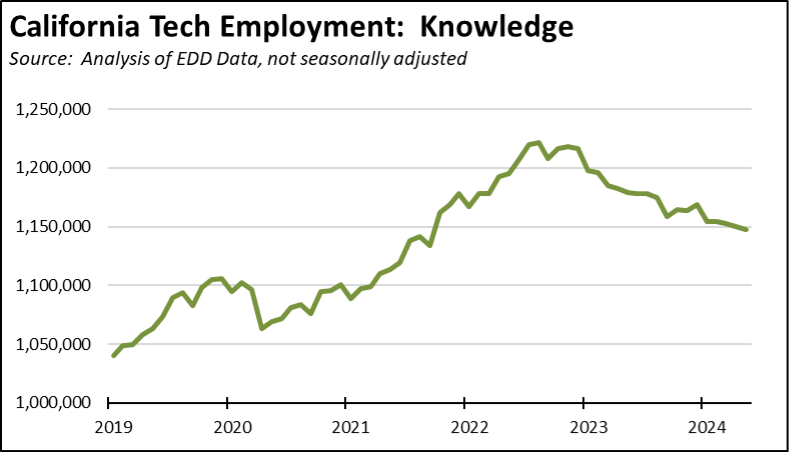
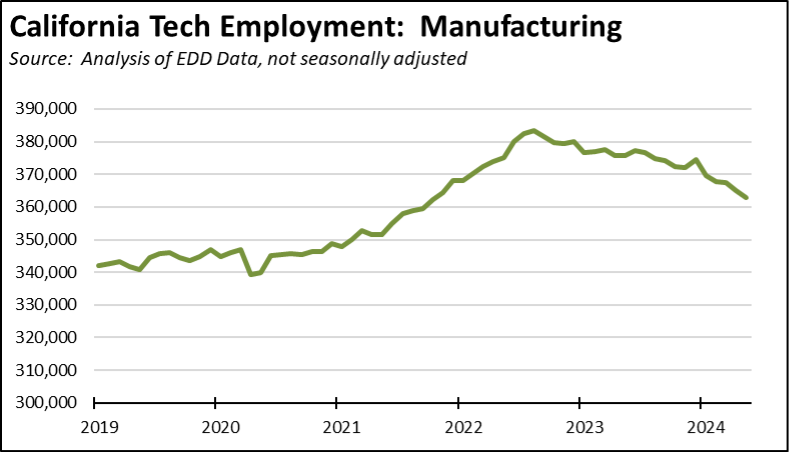
- Tech employment, using the Current Employment Statistics (CES) series comparable to the Center’s definition of this industry, has been falling. Compared to the peak in 2022, total losses to date through May are 94,700.
- Most of these losses have been from the knowledge-based components of the industry.
- The manufacturing portion has seen some reductions as well, but a lower level.
- A component of these shifts is due to the continuing move of some business operations to other emerging Tech centers. The agglomeration benefits from retaining a presence in Silicon Valley and the Bay Area, however, continue to outweigh many of the cost disadvantages, at least for employers. Much of the shift is still more likely due to the natural evolution of the industry as it restructures in a maturing phase especially after the rapid hiring splurges beginning during the Great Recession and in the recent Pandemic period. This maturing effect is also seen in the recent decline in Tech salaries, a factor which also has significance to the long-term potential for state revenues.
- Another contributing factor is the rapid change in focus to AI. Firms and business units specializing in this technology tend to have substantially lower staffing levels. On the tax revenue side, AI also means a heavy increase in the need for servers, but this property tax base is being developed not in California, but in other states with far lower electricity costs.
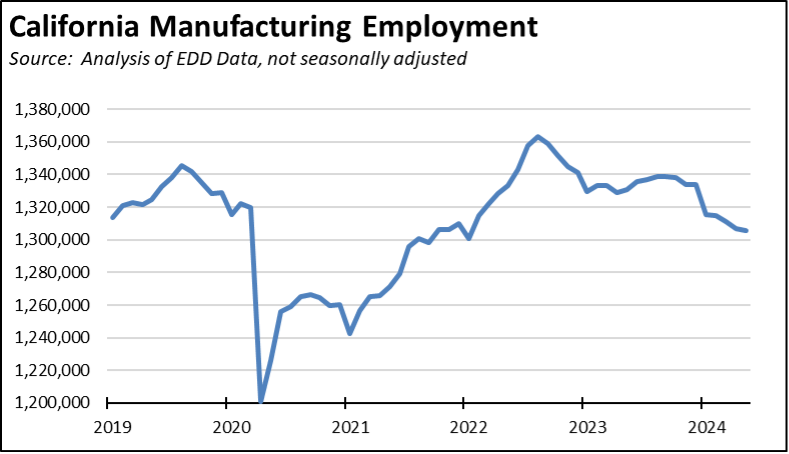
- Going beyond just the Tech component, California remains the nation’s leading manufacturing center. This lead, however, is slipping. After reaching a near-term high in 2022, manufacturing employment (not seasonally adjusted) has since dropped by 53,700 through May.
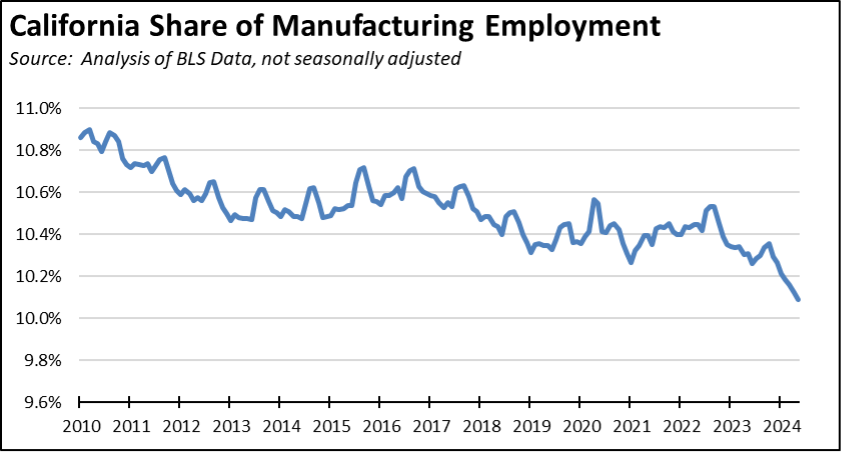
- And while California still leads, the state’s share of US manufacturing again has been dropping since 2010. This drop accelerated in the last 2 years and is likely to increase further as the electric vehicle, battery, and chip factories now being constructed in the Southeast, Ohio, and Arizona move into full production.
- Manufacturing also is the largest source of R&D activities in California, and this factor has been critical for this industry being able to sustain its presence in the state even in the face of rising operating costs. Rather than promote this key industry, the recently passed state budget weakens this competitive factor through a reduction in the R&D tax credit.
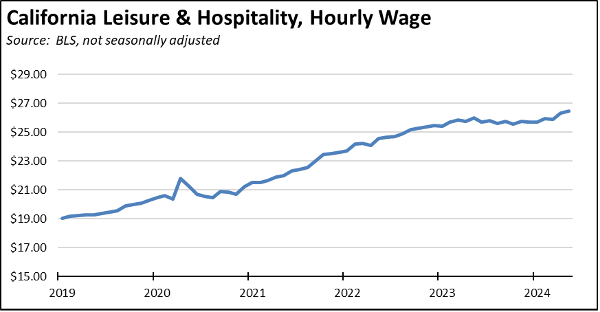
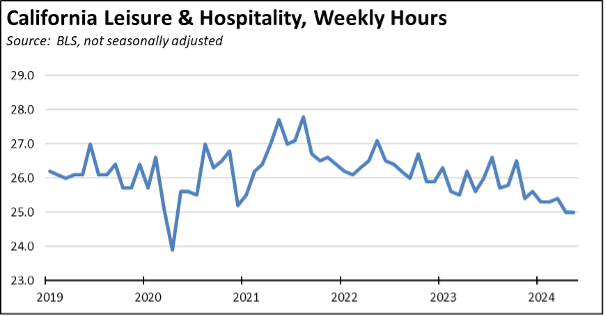
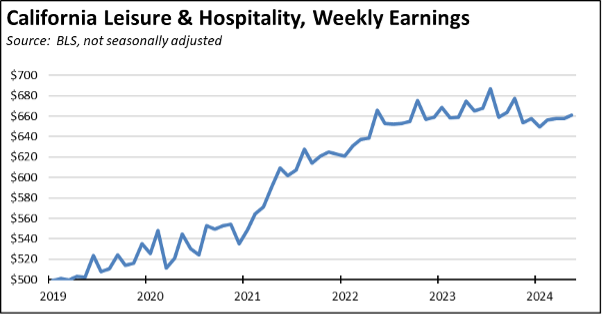
- As an industry, Leisure & Hospitality was one of the hardest hit by the state’s pandemic closures, with the number of jobs plunging by nearly half in only two months and returning to recovery levels only within the most recent two months. This industry is also a leading source of minimum wage jobs, and is generally more affected by both the general and industry-specific wage hikes directly and by wage compaction effects throughout their employee base. Effects on the previous two industries are more limited, with the greater impacts coming on overtime costs.
- Average hourly wages have increased, rising 38.9% since the beginning of 2019.
- In response to rising labor costs, however, employers have adjusted in part by reducing the average number of hours worked through various operational changes. Average weekly hours are down 4.6% from the beginning of 2019, and down 10.1% from their near-term peak in 2021.
- The net result is that while the hourly wage has increased, average weekly pay has remained essentially level in this industry since 2022.
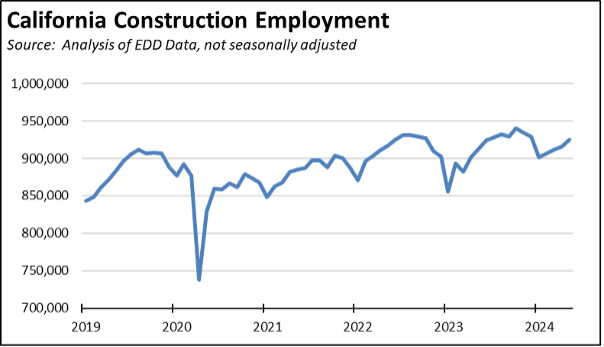
- Although more highly seasonal, construction has been a source of growth in the job numbers in recent months, in general coming in above the pre-pandemic levels in 2019.
- The residential construction numbers, however, have seen less movement. While the legislature continues to enact measures to streamline the housing development process in an effort to reduce the cost of new housing supplies, these generally contain a number of other provisions that offset the potential savings both directly and through additional paperwork requirements. Funding for affordable housing in recent years has provided some additional support for construction jobs, but the special provisions and various cost additions linked to this funding result in high per unit costs that severely limit the amount of housing that can be built and consequently the number of jobs that can be created.
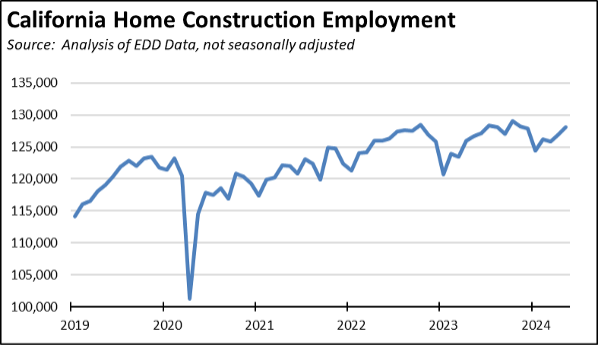
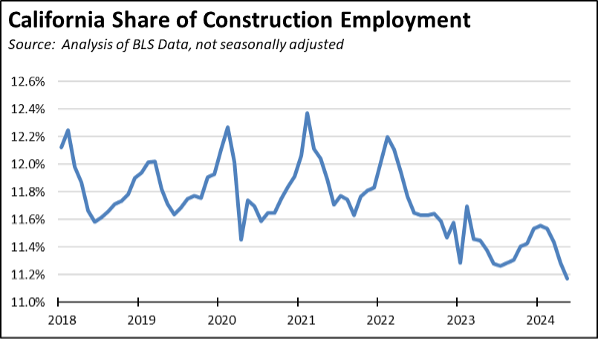
- The relative ease of building things in other states in conjunction with increased demand for those things as their economies have grown faster has seen California’s share of US construction decline by a full percent. Construction employment has increased, but the state’s red tape on the construction process has kept it from growing more.
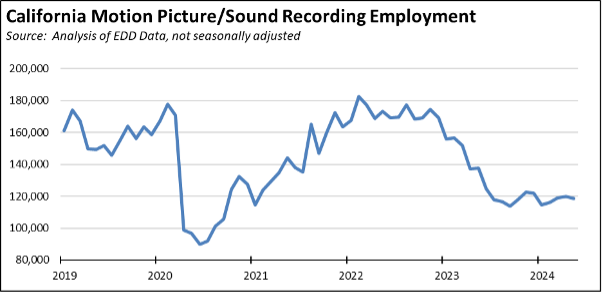
- The recent movie and TV production strike has been having longer term effects on this industry’s employment in the state. The number of jobs in Motion Picture & Sound Recording Industries has dropped to only somewhat above the pandemic period lows.
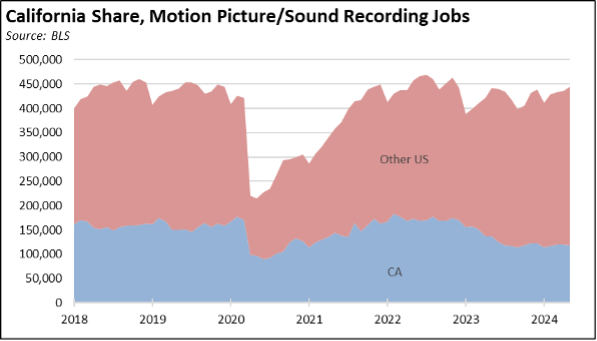
- Many of these jobs still exist, but they increasingly have moved to other states, especially competing centers such as in Georgia and New Mexico. Overall, California’s share of this industry has dropped from a recent high of 42.4% in 2022, to 26.7% in the most recent data for May.
- As indicated, Healthcare & Social Assistance has been one of the two primary sources of jobs growth within the state in recent years. This industry represents a mix of growth drivers, with growth coming both from private spending but also significant increases coming from public funding such as Medi-Cal and Obamacare and from increased use of Medicare as the population has aged. The Social Assistance component is predominantly funded through the state budget, comprised heavily of minimum wage In-Home Supportive Services (IHSS) workers earning the equivalent of $29,800 annually from the 4th quarter 2023 QCEW data.
- The Healthcare component has produced a net increase of 146.400 jobs since the Pandemic.

- At a net increase of 199,800 predominantly minimum wage jobs, Social Assistance has produced 36% more.
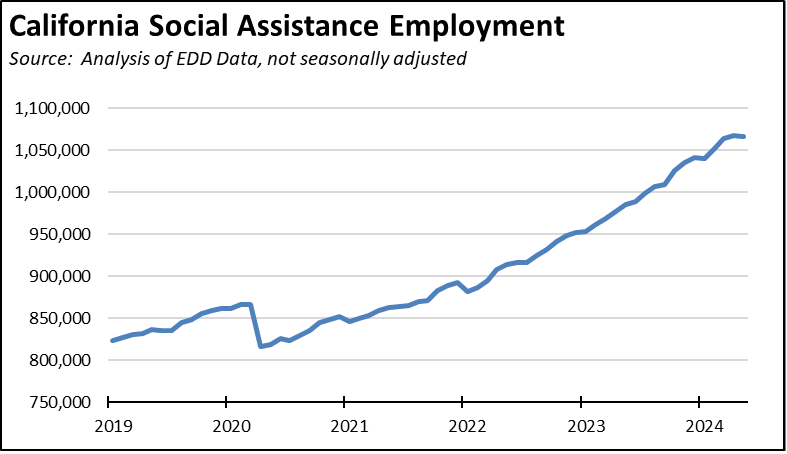
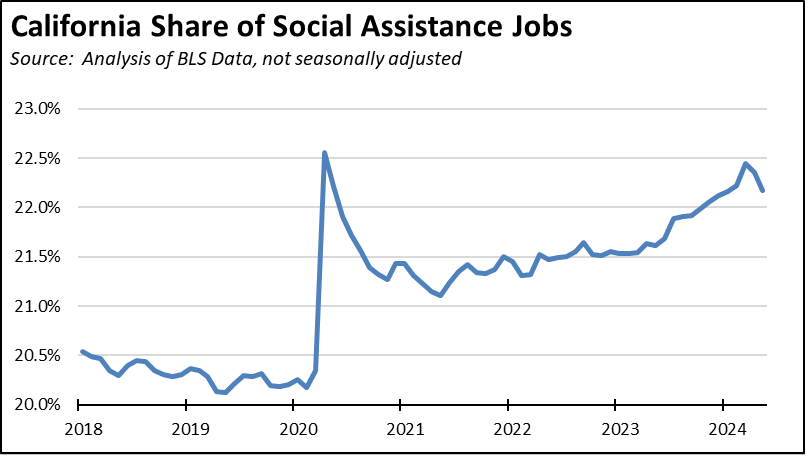
- California also depends more heavily on these state-funded minimum wage jobs to pump up its overall job numbers. California contains over 22% of all Social Assistance jobs nationally, a level that has been increasing in recent years.
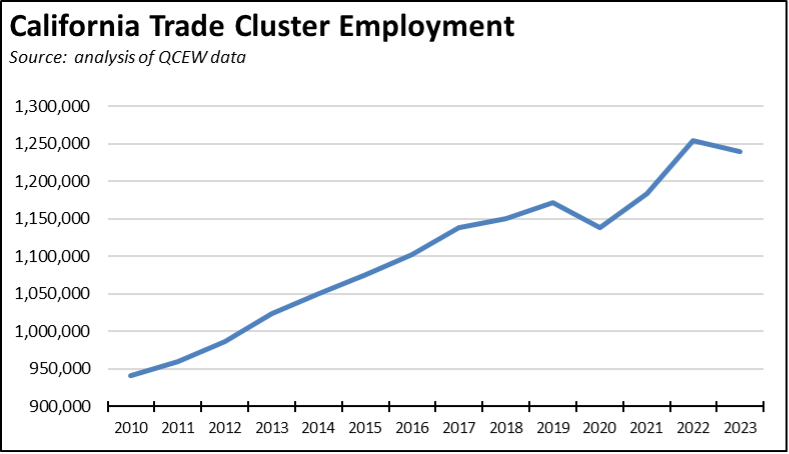
- Using the same definition from our recent report on the San Pedro Bay Ports and the QCEW data, jobs within the state’s Trade Cluster have been a source of growth in middle-class wage, blue-collar jobs. In 2023, this jobs cluster showed a gain of 68,400 jobs compared to pre-pandemic 2019, at an average annual wage of $61,300. As this jobs cluster has faced increased state and local opposition to required infrastructure investments and as regulations continue to increase substantially the cost of goods movement within California compared to other states, these jobs experienced a rare decline in 2023.
JOLTS Data Signals Weakness in Future Jobs Growth
While only representing one month’s worth of data, the April JOLTS (Job Openings & Labor Turnover Survey) data from US Bureaus of Labor Statistics (BLS) signals potential weakness for the job numbers in the months ahead. Unfilled job openings—an indicator of job growth potential—collapsed back to 2016 averages in California while still remaining above pre-pandemic levels in the US as a whole. These numbers suggest that employers in California are cutting back on hiring plans, while continuing to move forward in the other states.
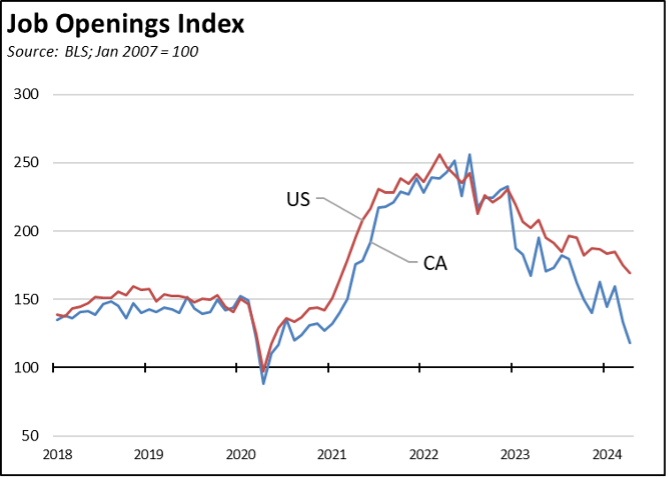
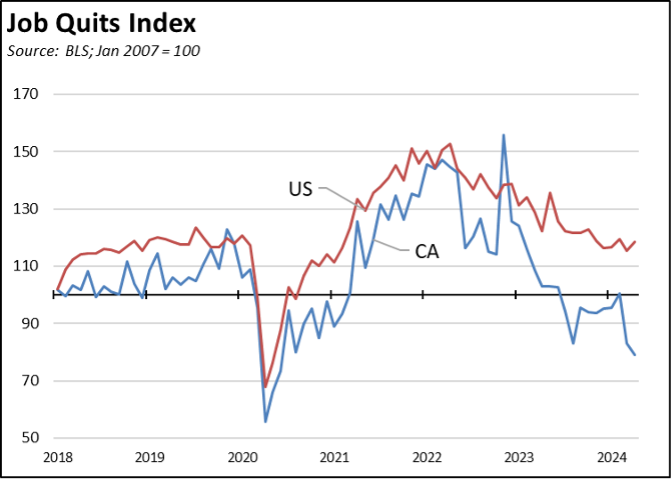
Workers are taking note. The number of California workers quitting their jobs in April sank to levels not seen since the early months of the Pandemic period and prior to that, during the Great Recession recovery in 2014. In the US overall, job quits were essentially at the 2019 pre-pandemic level as workers continued to feel confident in using one of the primary options to secure better pay and benefits through their own actions.
Califormer Businesses
Additional CaliFormer companies identified since our last report on this topic a few months ago are shown below. The listed companies include those that have announced: (1) moving their headquarters or full operations out of state, (2) moving business units out of state (generally back office operations where the employees do not have to be in a more costly California location to do their jobs), (3) California companies that expanded out of state rather than locate those facilities here, and (4) companies turning to permanent telework options, leaving it to their employees to decide where to work and live. The list is not exhaustive but is drawn from a monthly search of sources in key cities.
CaliFormers List
State UI Fund Sinks Further through Multi-year Deficits
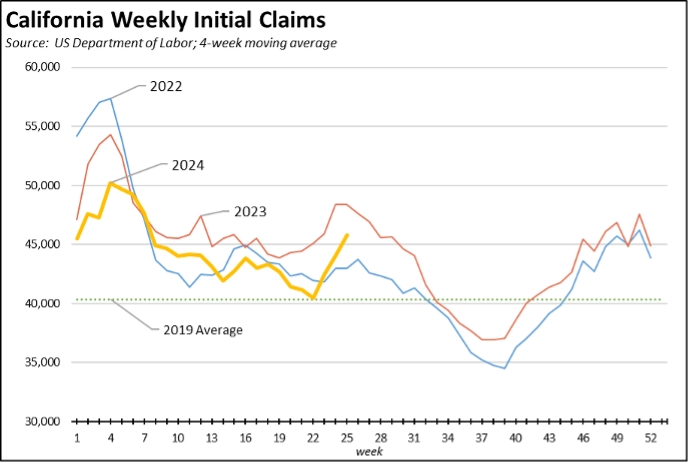
On a 4-week moving average basis, the number of initial claims has begun rising sharply towards the 2023 levels.
The total number of workers receiving unemployment—as measured by insured unemployed (a proxy for continuing claims)—continues to track near the 2023 numbers as well and substantially above the levels in 2022.
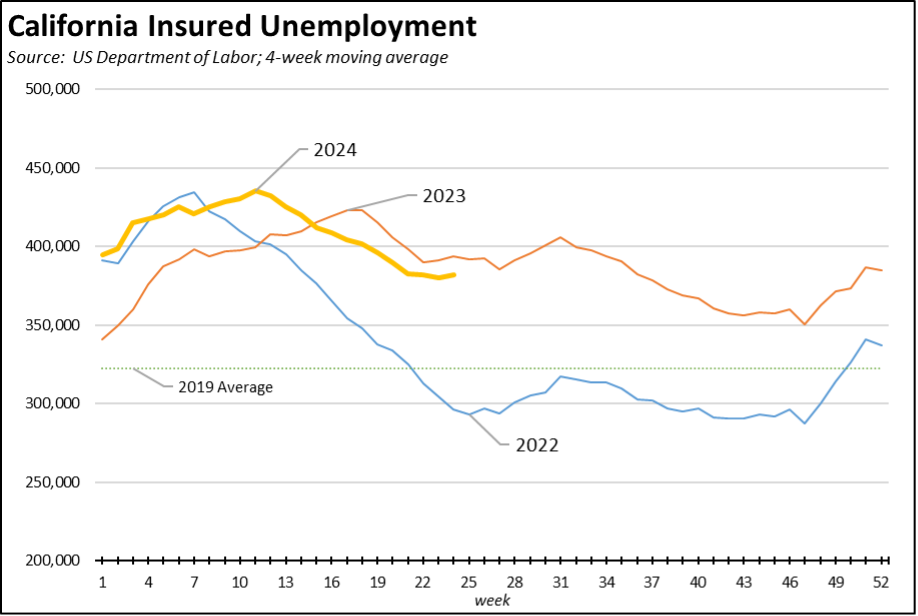
California’s reliance on this program as a substitute for earned wages remains high. The state accounts for 20.7% of initial claims, and 22.3% of insured unemployed.

The state’s failure again to deal with its mounting UI Fund debt in this year’s budget is pushing this critical program further into insolvency. The massive run-up in debt during the pandemic as the result of state-ordered job closures has triggered an increase in the federal tax component of the UI employment taxes, but this federal change is intended to force states who have carried a debt for too long to pay it off.
According to the recent forecast released by Employment Development Department, however, employers at least for the next few years will be paying this tax not to pay off the debt, but to cover the state’s expected annual shortfall in the program’s operations. EDD’s forecast expects the program to pay out 42% more ($2.018 billion) than what it will take in from the Employer Contributions in fiscal year 2024, and 30% more ($1.554 billion) than what it will take in in fiscal year 2025. These forecasts assume no new economic slowdown in this period.
California continues to be one of only two states still carrying a UI Fund debt over from the Pandemic, substantially so in the state’s case. California employers under the state’s operation of this program are expected to watch this debt grow ever larger even as they are being charged more in taxes.
