Below are highlights from the recently released trade data from the US Census Bureau and US Bureau of Economic Analysis. The data this month includes the annual revisions affecting previous data beginning in 2019. To view additional data and analysis related to the California economy visit our website at www.centerforjobs.org/ca.
Trade Growth Driven by Imports
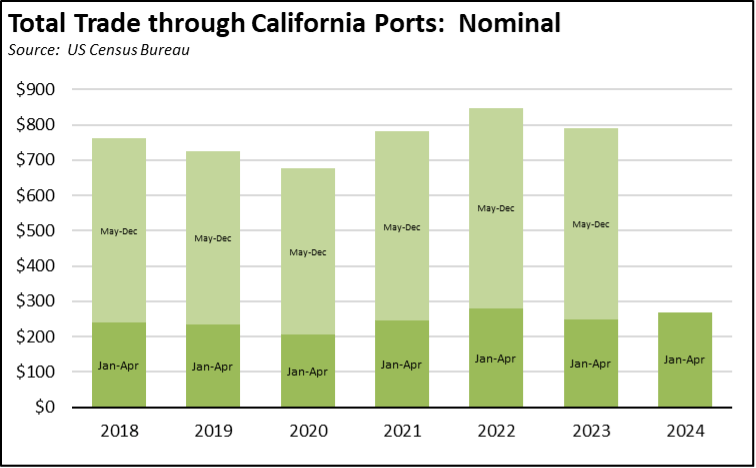
Dominated by the surge in imports, total trade through the state’s ports rose $8.4 billion (13.3%) compared to April 2023. On a nominal basis, total trade through the state’s ports in the first 4 months of the year was 8.3% higher than the same period in 2023, and only $10 billion below the level reached in 2022.
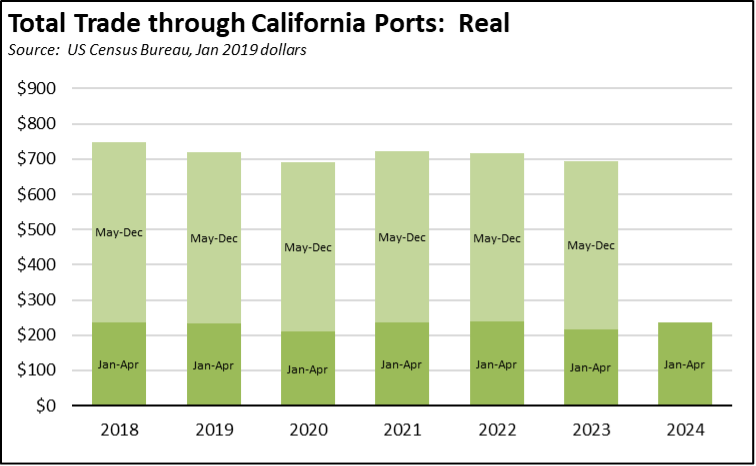
The results are similar when instead looking at trade flow volumes in constant dollars. In constant terms, trade flows also showed a 1.7% expansion over the same period in pre-pandemic 2019.
While improving in recent months, the state ports’ share of total US trade flows remains well below the peaks experienced in the early 2000s. The importance of total trade market share is explored in detail in our recent report on the Ports of Los Angeles and Long Beach, the largest port complex in North America and the ninth largest worldwide.
Looking at the two ports alone, the combined direct, indirect, and induced effects in 2022 supported an estimated 226,000 jobs, $19.93 billion in labor income, and $2.78 billion in state and local tax revenues. Including the related jobs from the export and import goods traded through the ports, the ports in 2022 supported 3.1 million jobs nationally, or 1 out of every 51 jobs in the US.
This port activity in turn underlies the broader Trade Cluster in Southern California. In 2022, this middle-class wage job center supported 15.9% of all jobs within Southern California along with 16.9% of regional labor income, producing $47.81 billion in state and local tax revenues. As a jobs base, the Trade Cluster has played a key role replacing blue collar jobs—especially for workers with a high school education or less—as the region’s manufacturing employment has continued to decline. While other jobs remained closed under state rules, Trade was the largest source of new jobs during the pandemic, producing 53% of net jobs growth in the region between 2019 and 2022 and creating those jobs at an average middle-class wage in 2022 of $76,800. The Trade Cluster is the second largest source of jobs for Latinos in the region, and is also a significant gateway job for immigrants—41.5% of Southern California Trade workers in 2022 were immigrants (naturalized and non-citizens) compared to an overall average of 34.6% in the region.
While these economic levels remain significant, the ports and Southern California trade overall have come under increasing competition as costs have risen due to increasing regulations as well as other state and local policies such as for energy. Aggressive expansion investments by the East and Gulf Coast ports and related intermodal capacity have seen the Los Angeles and Long Beach total market share slip from 30.0% of all containerized traffic in 2006 to 22.9% in 2022 and 22.5% in 2023. This market share loss equates to a loss of 46,100 jobs, $3.92 billion in foregone labor income, and $561 million lower state and local tax revenues annually. Every 1% market share loss by the two ports undermines an estimated 8,000 blue-collar, middle-class wage jobs in the broader regional Trade Cluster.
For more details on the Southern California ports, the regional Trade Cluster, and their workers, read the full report at: www.centerforjobs.org/economic-importance-of-trade.
California Goods Exports
Total California origin goods exports were up only $30.9 million from April 2023 (up 0.2%). California remained in 2nd place with 8.74% of all US goods exports (12 month moving total), behind Texas at 22.27%.
California Goods Imports
Total California destination goods imports rose $3.4 billion from April 2023 (up 9.5%).
Top 20 Exports, April 2024
Top 20 exports by value are shown below, along with the change from Apr 2023.